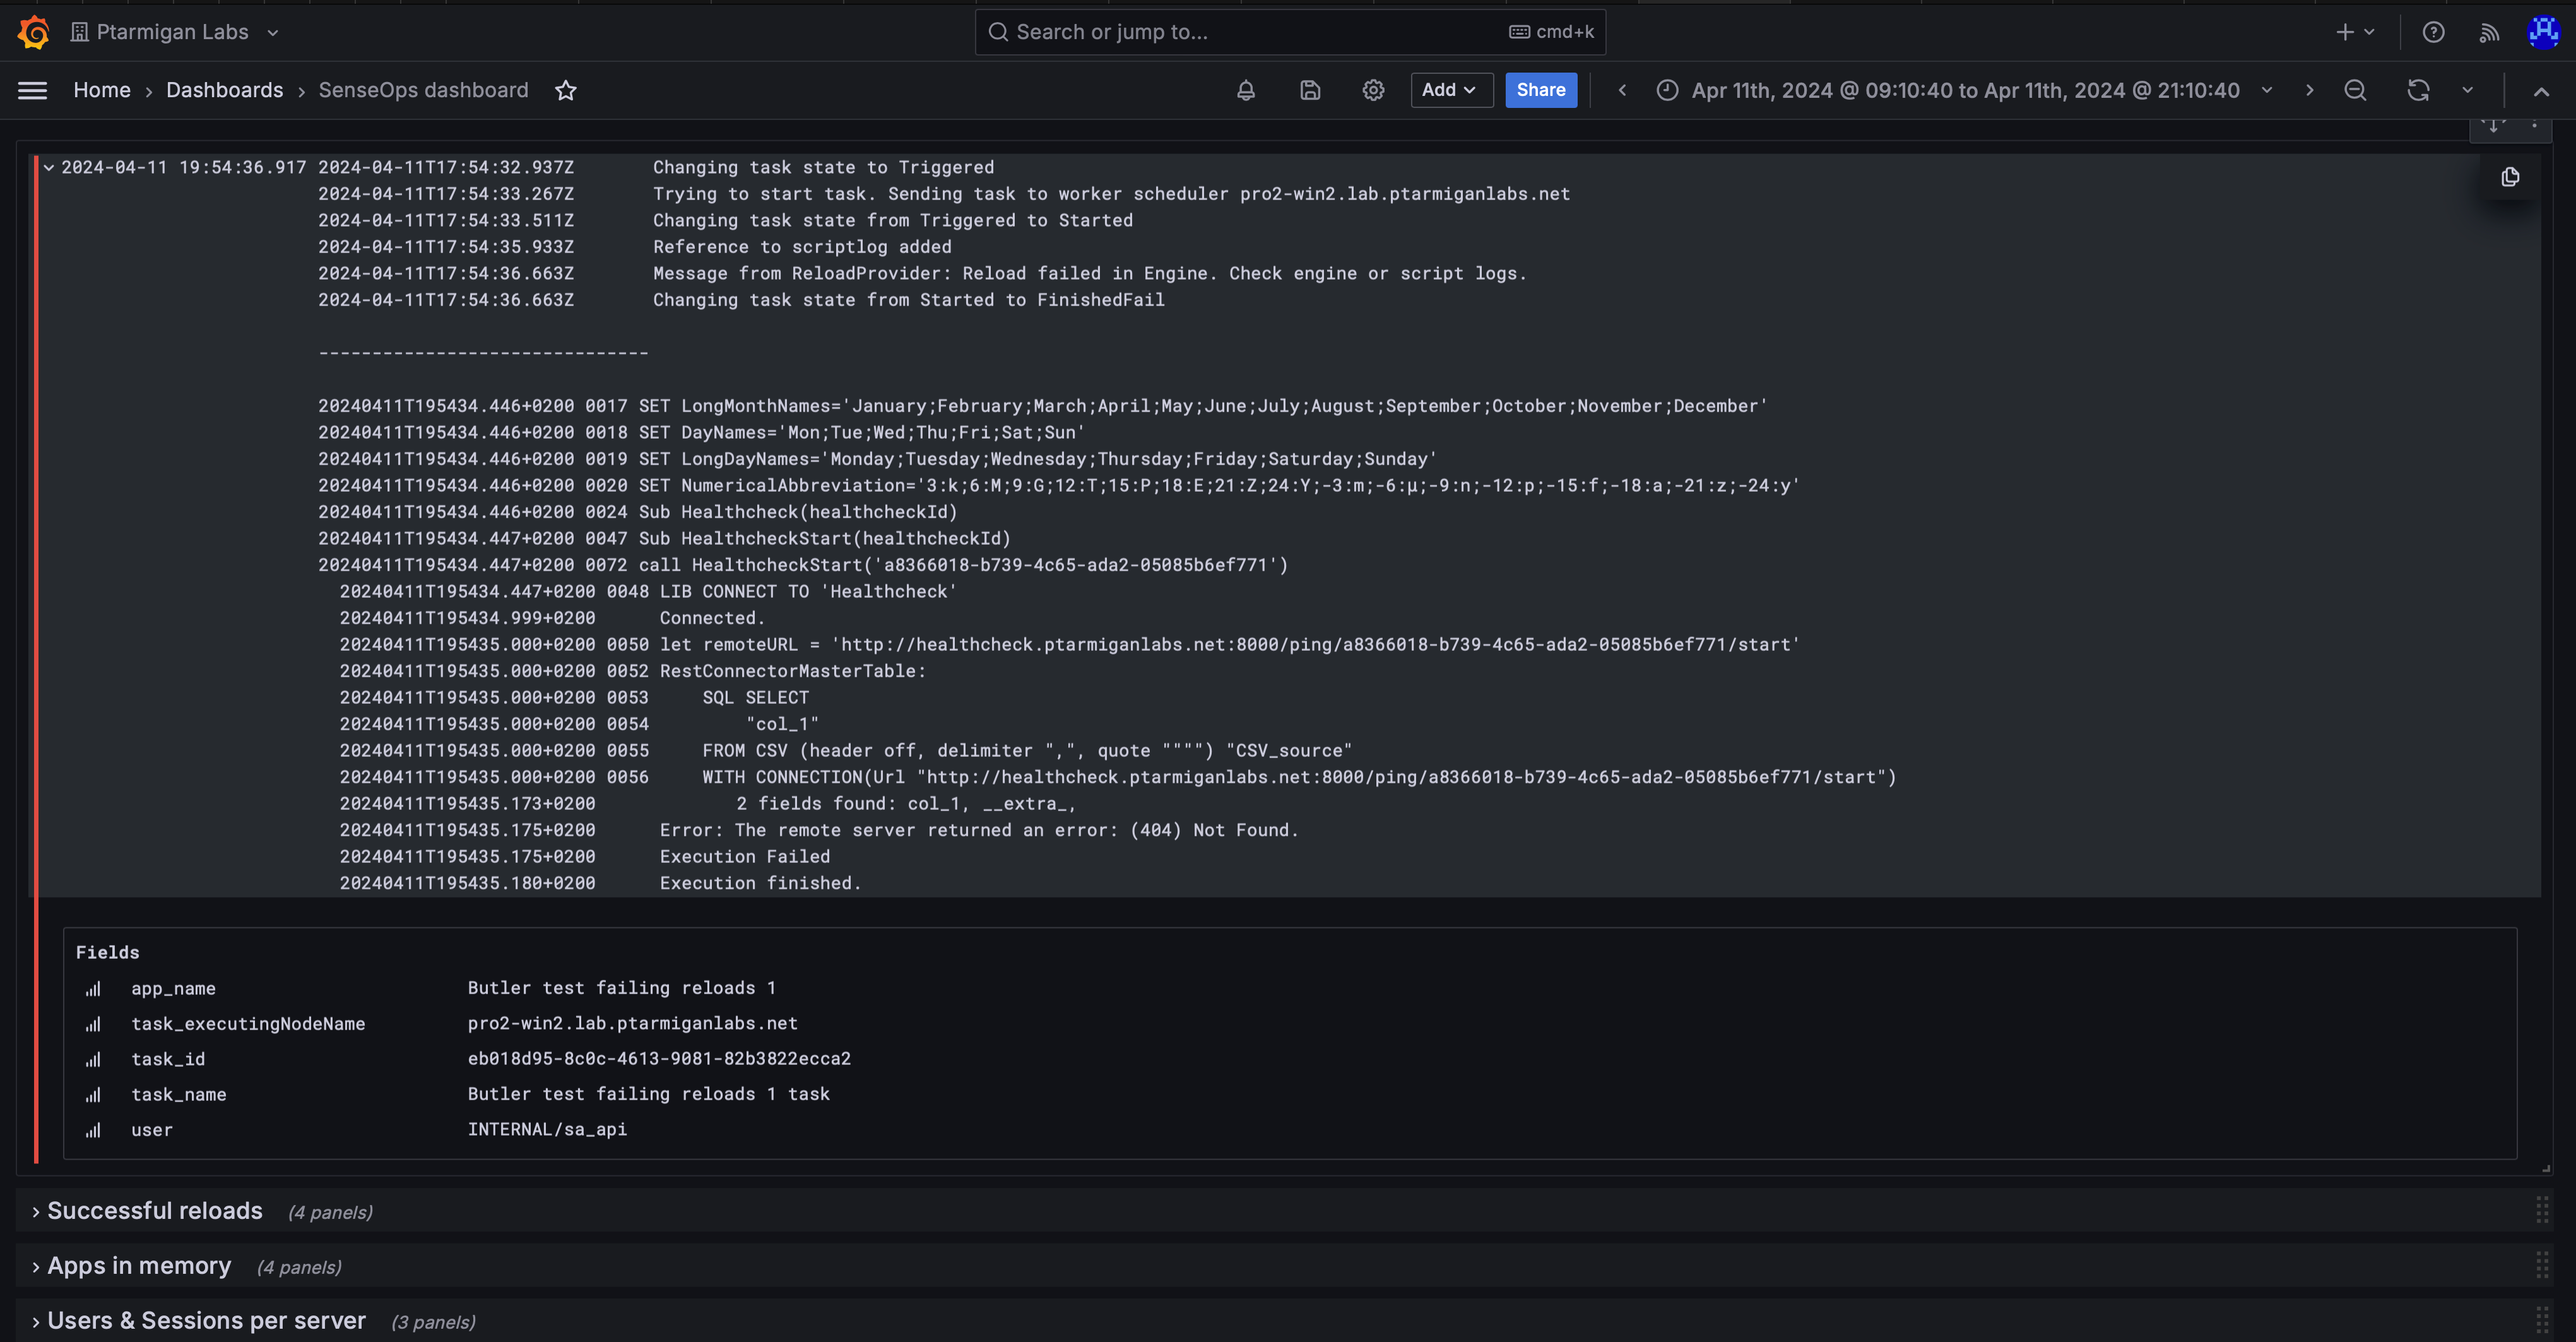
Visualizing failed reloads in Grafana
When a reload fails, Butler can send information about the failed reload to InfluxDB.
The data stored in InfluxDB is described here.
Once the data is in InfluxDB it can be visualized in Grafana or similar tools.
Grafana has a good log viewer that can be used to visualize the data.
Note how even the script log is stored in InfluxDB, so you can see the last few lines of the reload script log in Grafana.
This makes it easy to right away see what went wrong, especially when dealing with reloads that happened a while back.

Configuration
Configuration of this feature is described here.