New Relic Integration
Comprehensive observability platform integration for metrics, logs, events, and incident management.
What is New Relic?
New Relic is not primarily an incident management tool, but rather a complete SaaS platform for handling metrics, logs, events, and trace messages. Their event handling includes alert management features that integrate seamlessly with Butler and Qlik Sense.
Key Capabilities
- Unified Observability: Metrics, logs, events, and traces in one platform
- Alert Management: Built-in incident handling with escalation policies
- Integration Ecosystem: Connects with PagerDuty, VictorOps, OpsGenie, Slack, Teams, and more
- Generous Free Tier: Excellent for testing Butler alerts and small deployments
- Butler SOS Integration: Works alongside Butler SOS for complete Qlik Sense monitoring
How Butler Integrates with New Relic
Integration Architecture
The Butler-New Relic integration creates a seamless incident management workflow:
- Event Ingestion: Butler sends alerts to New Relic using their Events and Logs APIs
- Metadata Enrichment: Failed reload tasks include app metadata and script log excerpts
- Alert Conditions: New Relic rules define when to create incidents from Butler events
- Alert Policies: Group conditions and define notification channels
- Incident Management: New Relic manages incident lifecycle until resolution
Integration Benefits
Immediate Incident Visibility
- Near-instantaneous: Events forwarded within seconds of Qlik Sense failures
- Rich Context: Include script logs for immediate troubleshooting insight
- Persistent State: Incidents remain open until explicitly acknowledged
- Multiple Channels: Notifications via web, mobile, email, Slack, Teams, PagerDuty
Operational Intelligence
When combined with Butler SOS, New Relic provides comprehensive Qlik Sense observability:
- Performance Metrics: Server CPU, memory, user sessions
- Operational Events: Failed/successful reloads, service status
- Historical Analysis: Trend analysis and capacity planning
- Correlation: Connect performance issues with operational events
Enterprise Integration
- ITSM Integration: Connect with ServiceNow, Jira Service Management
- Communication Tools: Slack, Teams, email notifications
- On-Call Management: PagerDuty, VictorOps, OpsGenie integration
- Webhooks: Custom integrations with any system
New Relic Dashboards
Butler provides rich operational dashboards when integrated with New Relic:
Light Mode Dashboard
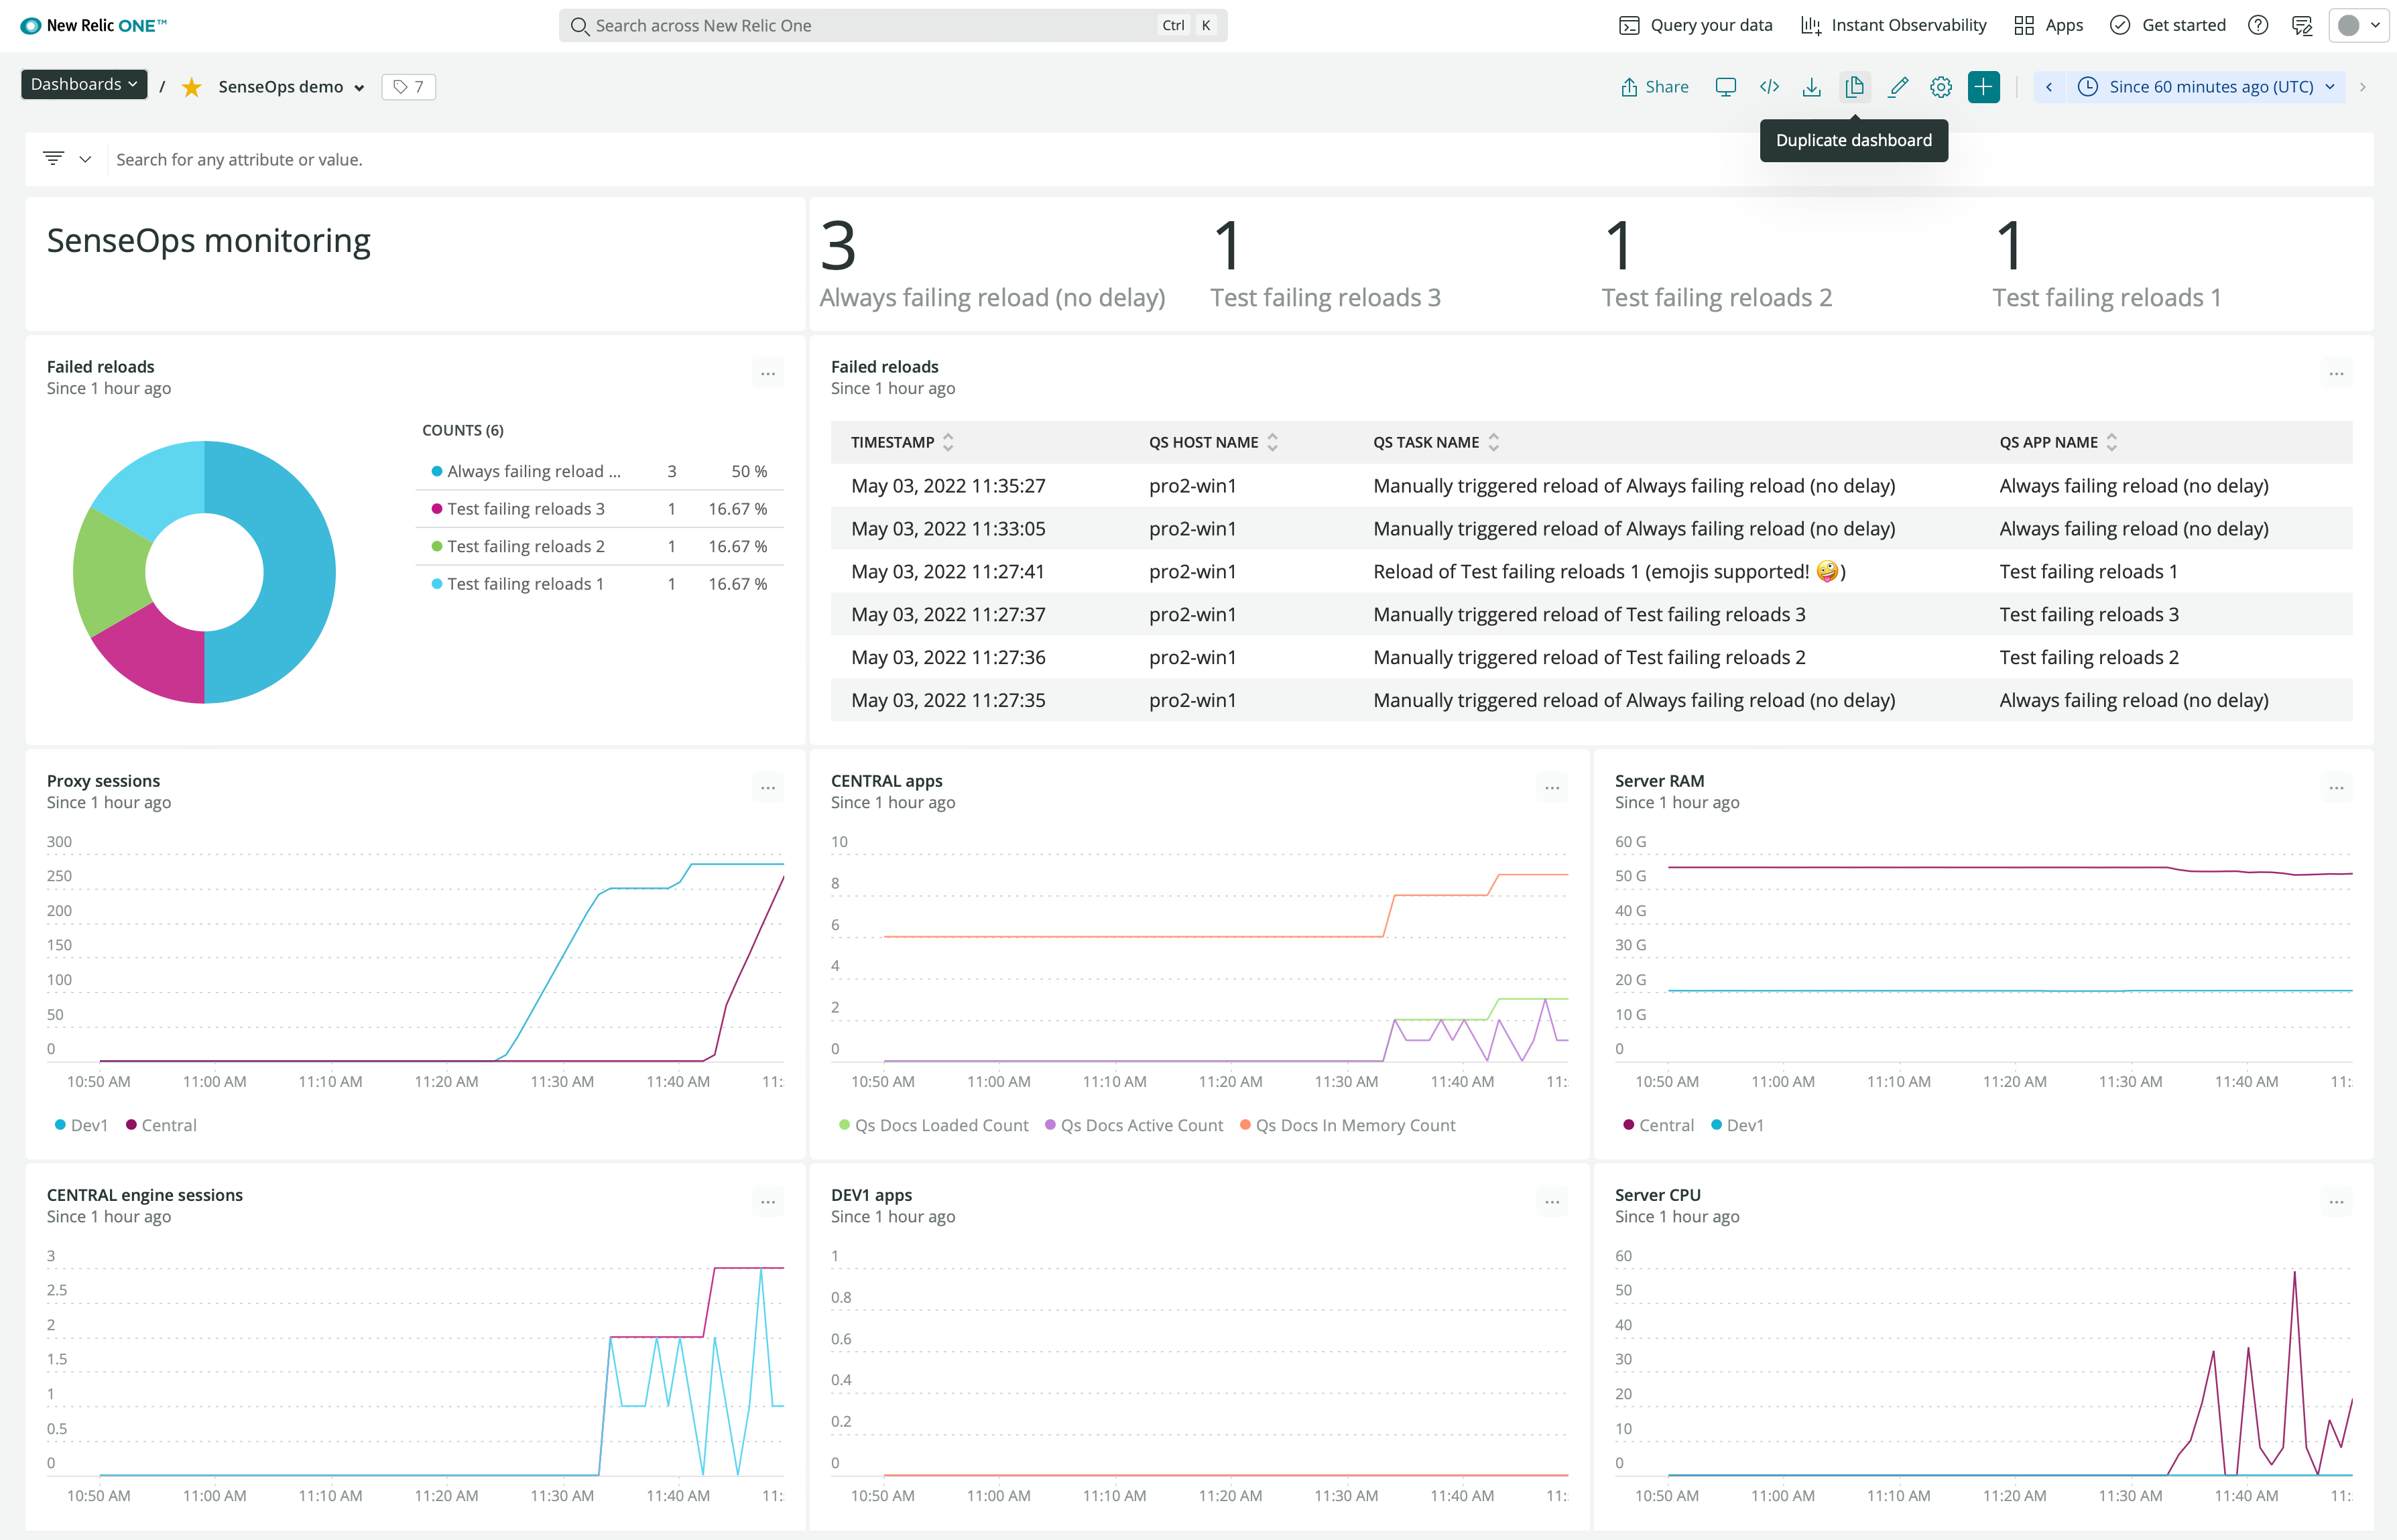
New Relic dashboard showing Butler metrics and incidents in light mode
Dark Mode Dashboard with Different Time Range
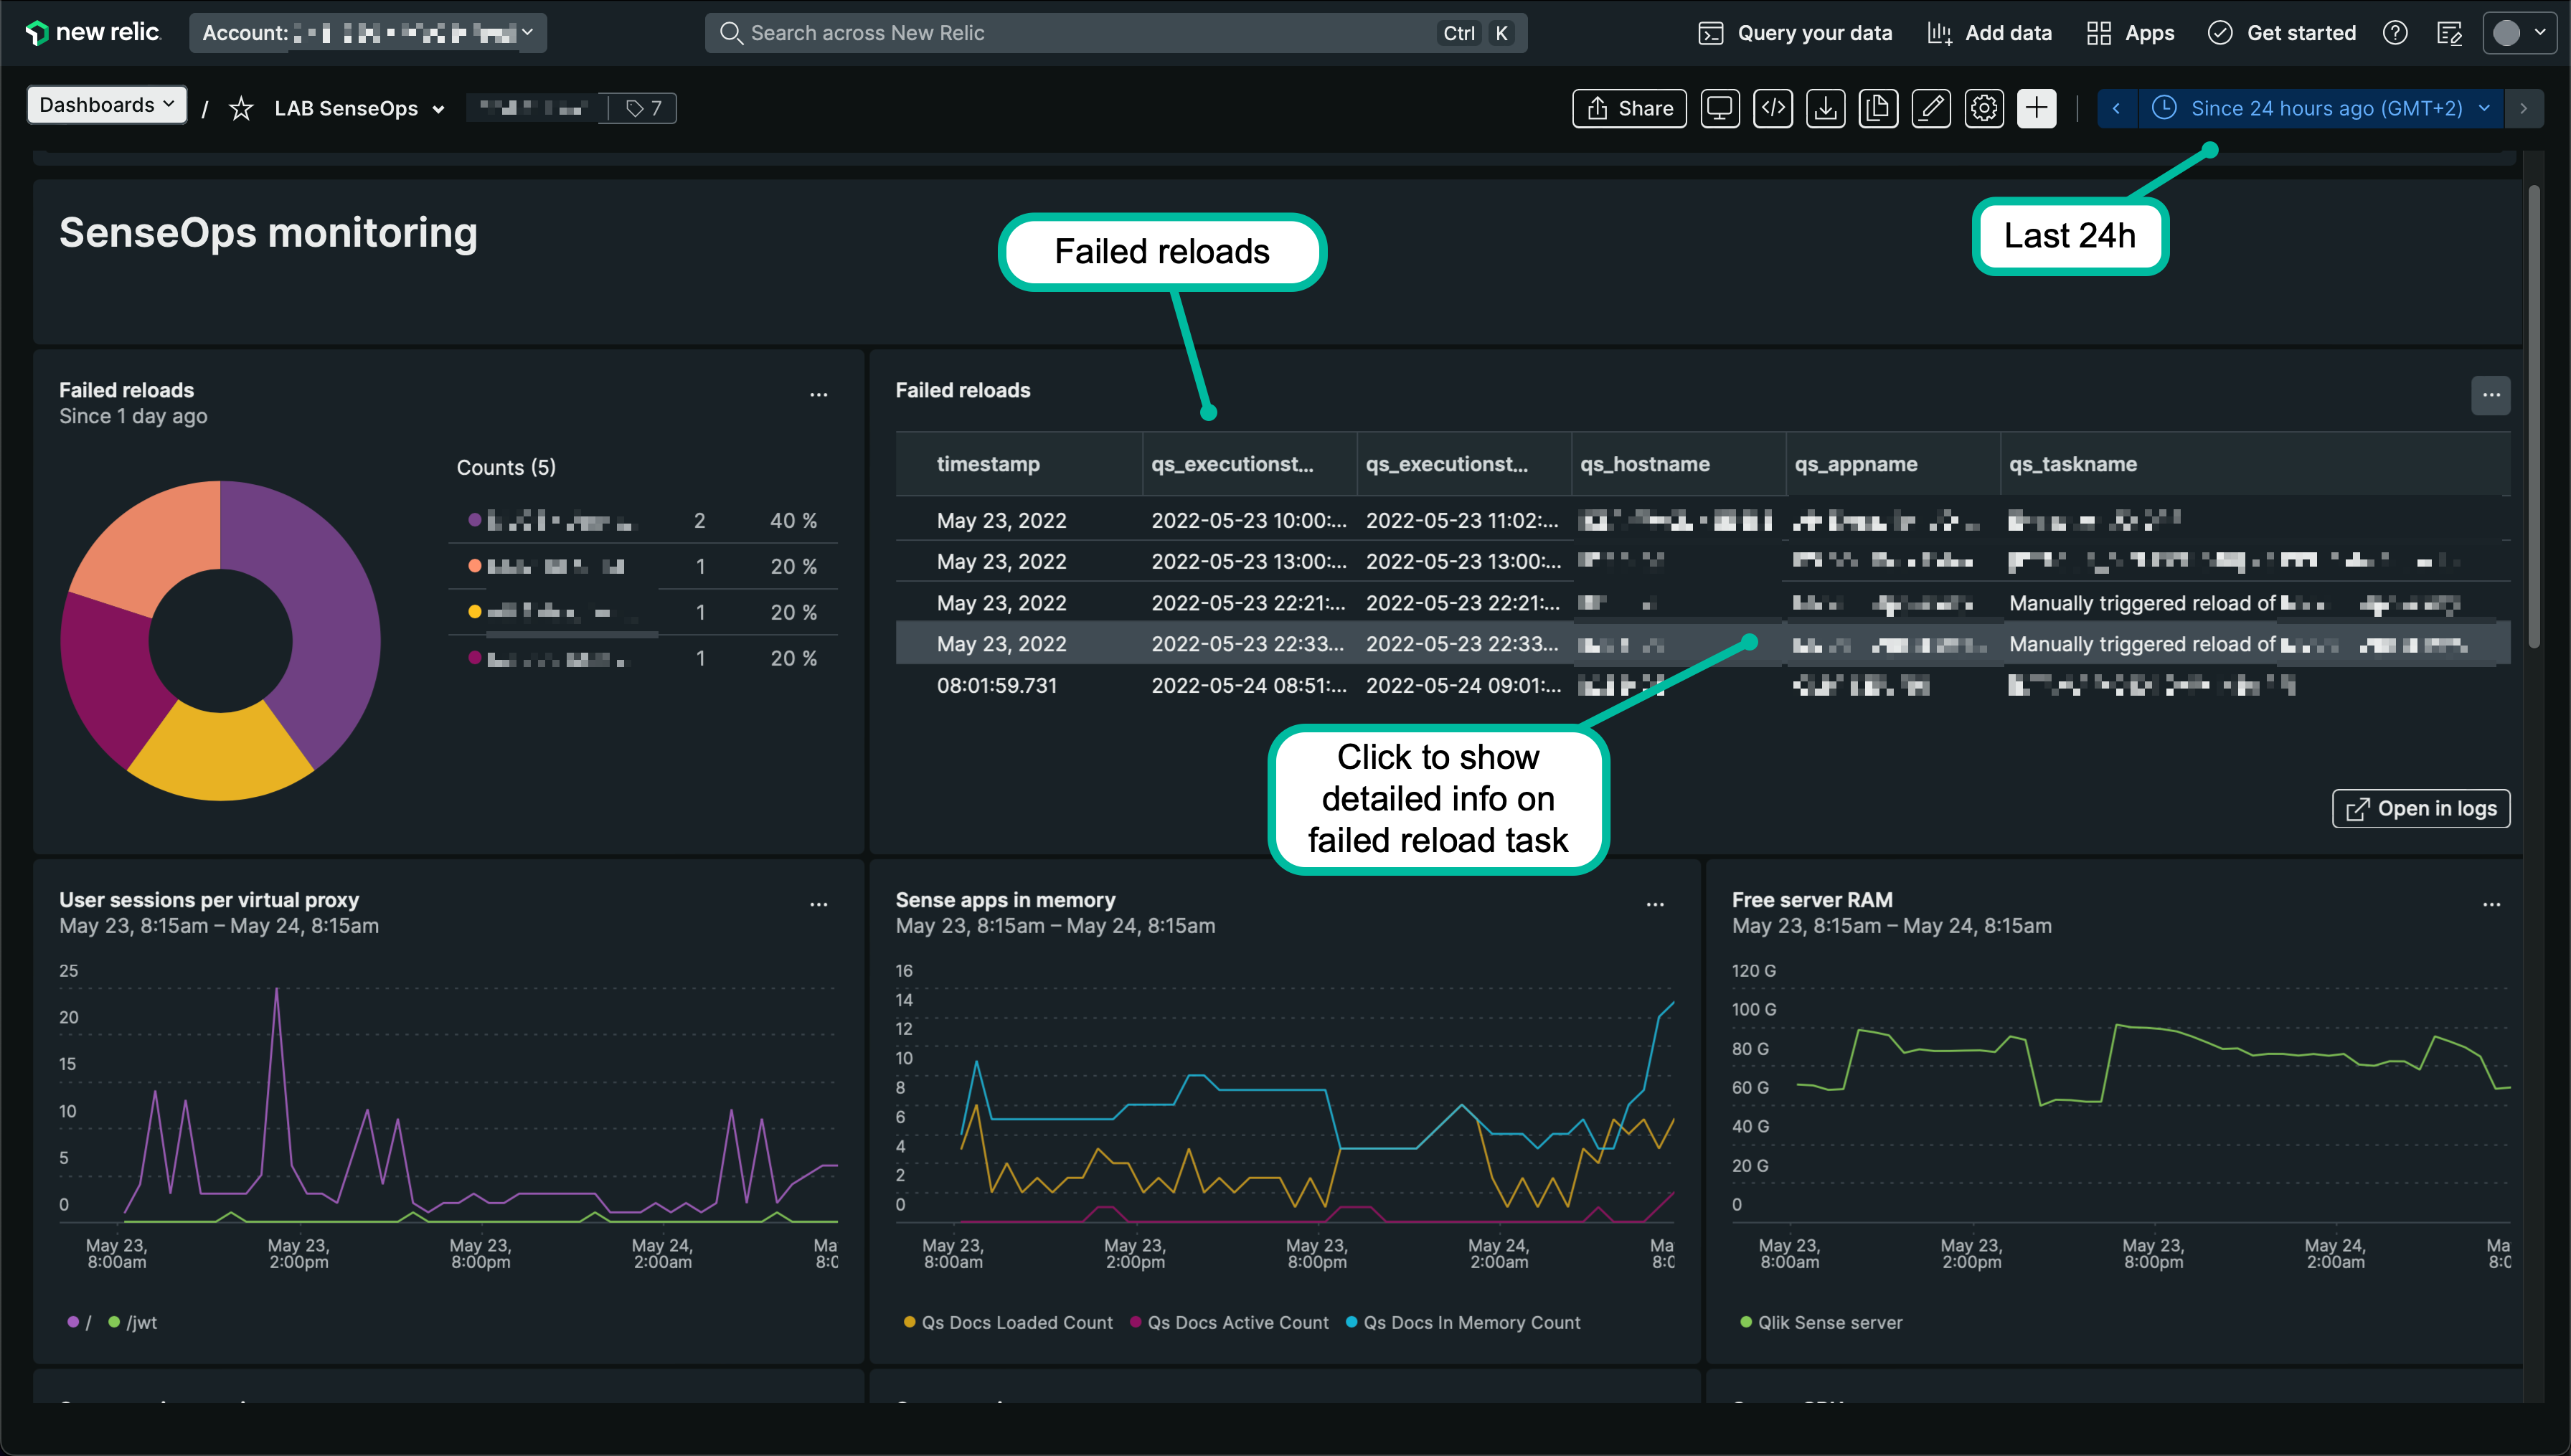
New Relic dashboard with different time range in dark mode
Detailed Failure Information
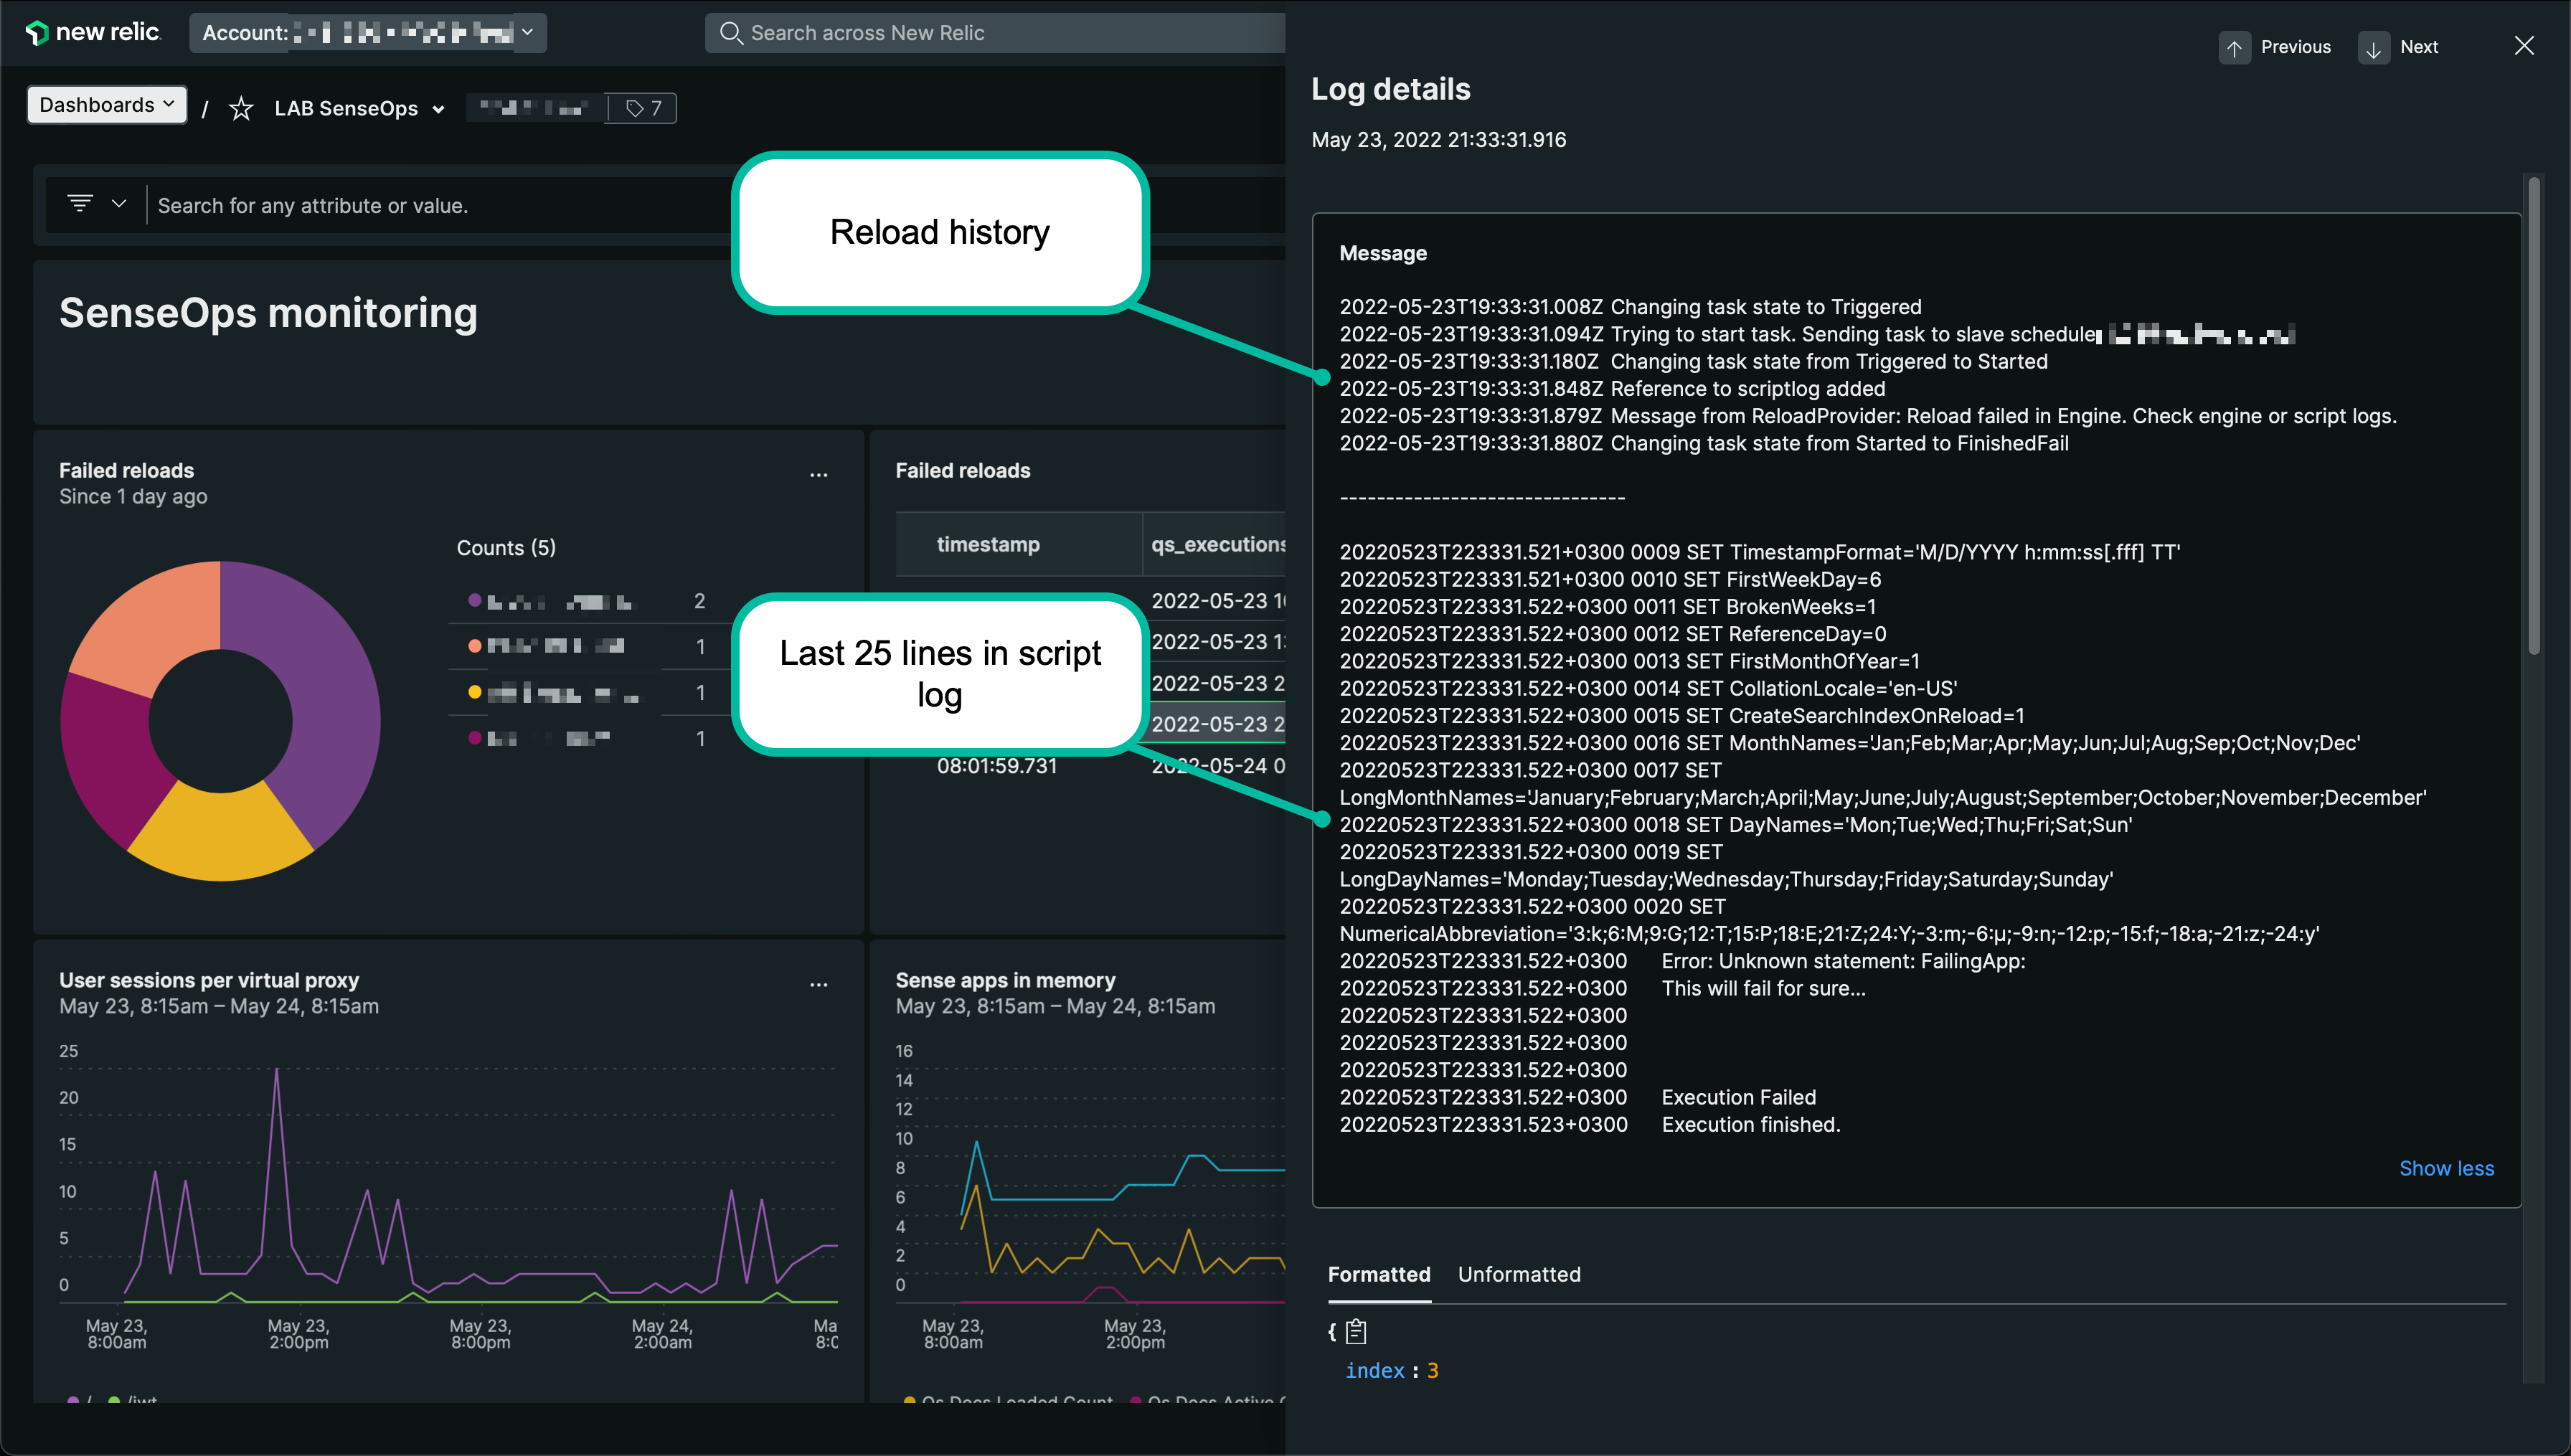
Detailed failed reload information including script logs
Butler SOS Metrics Integration
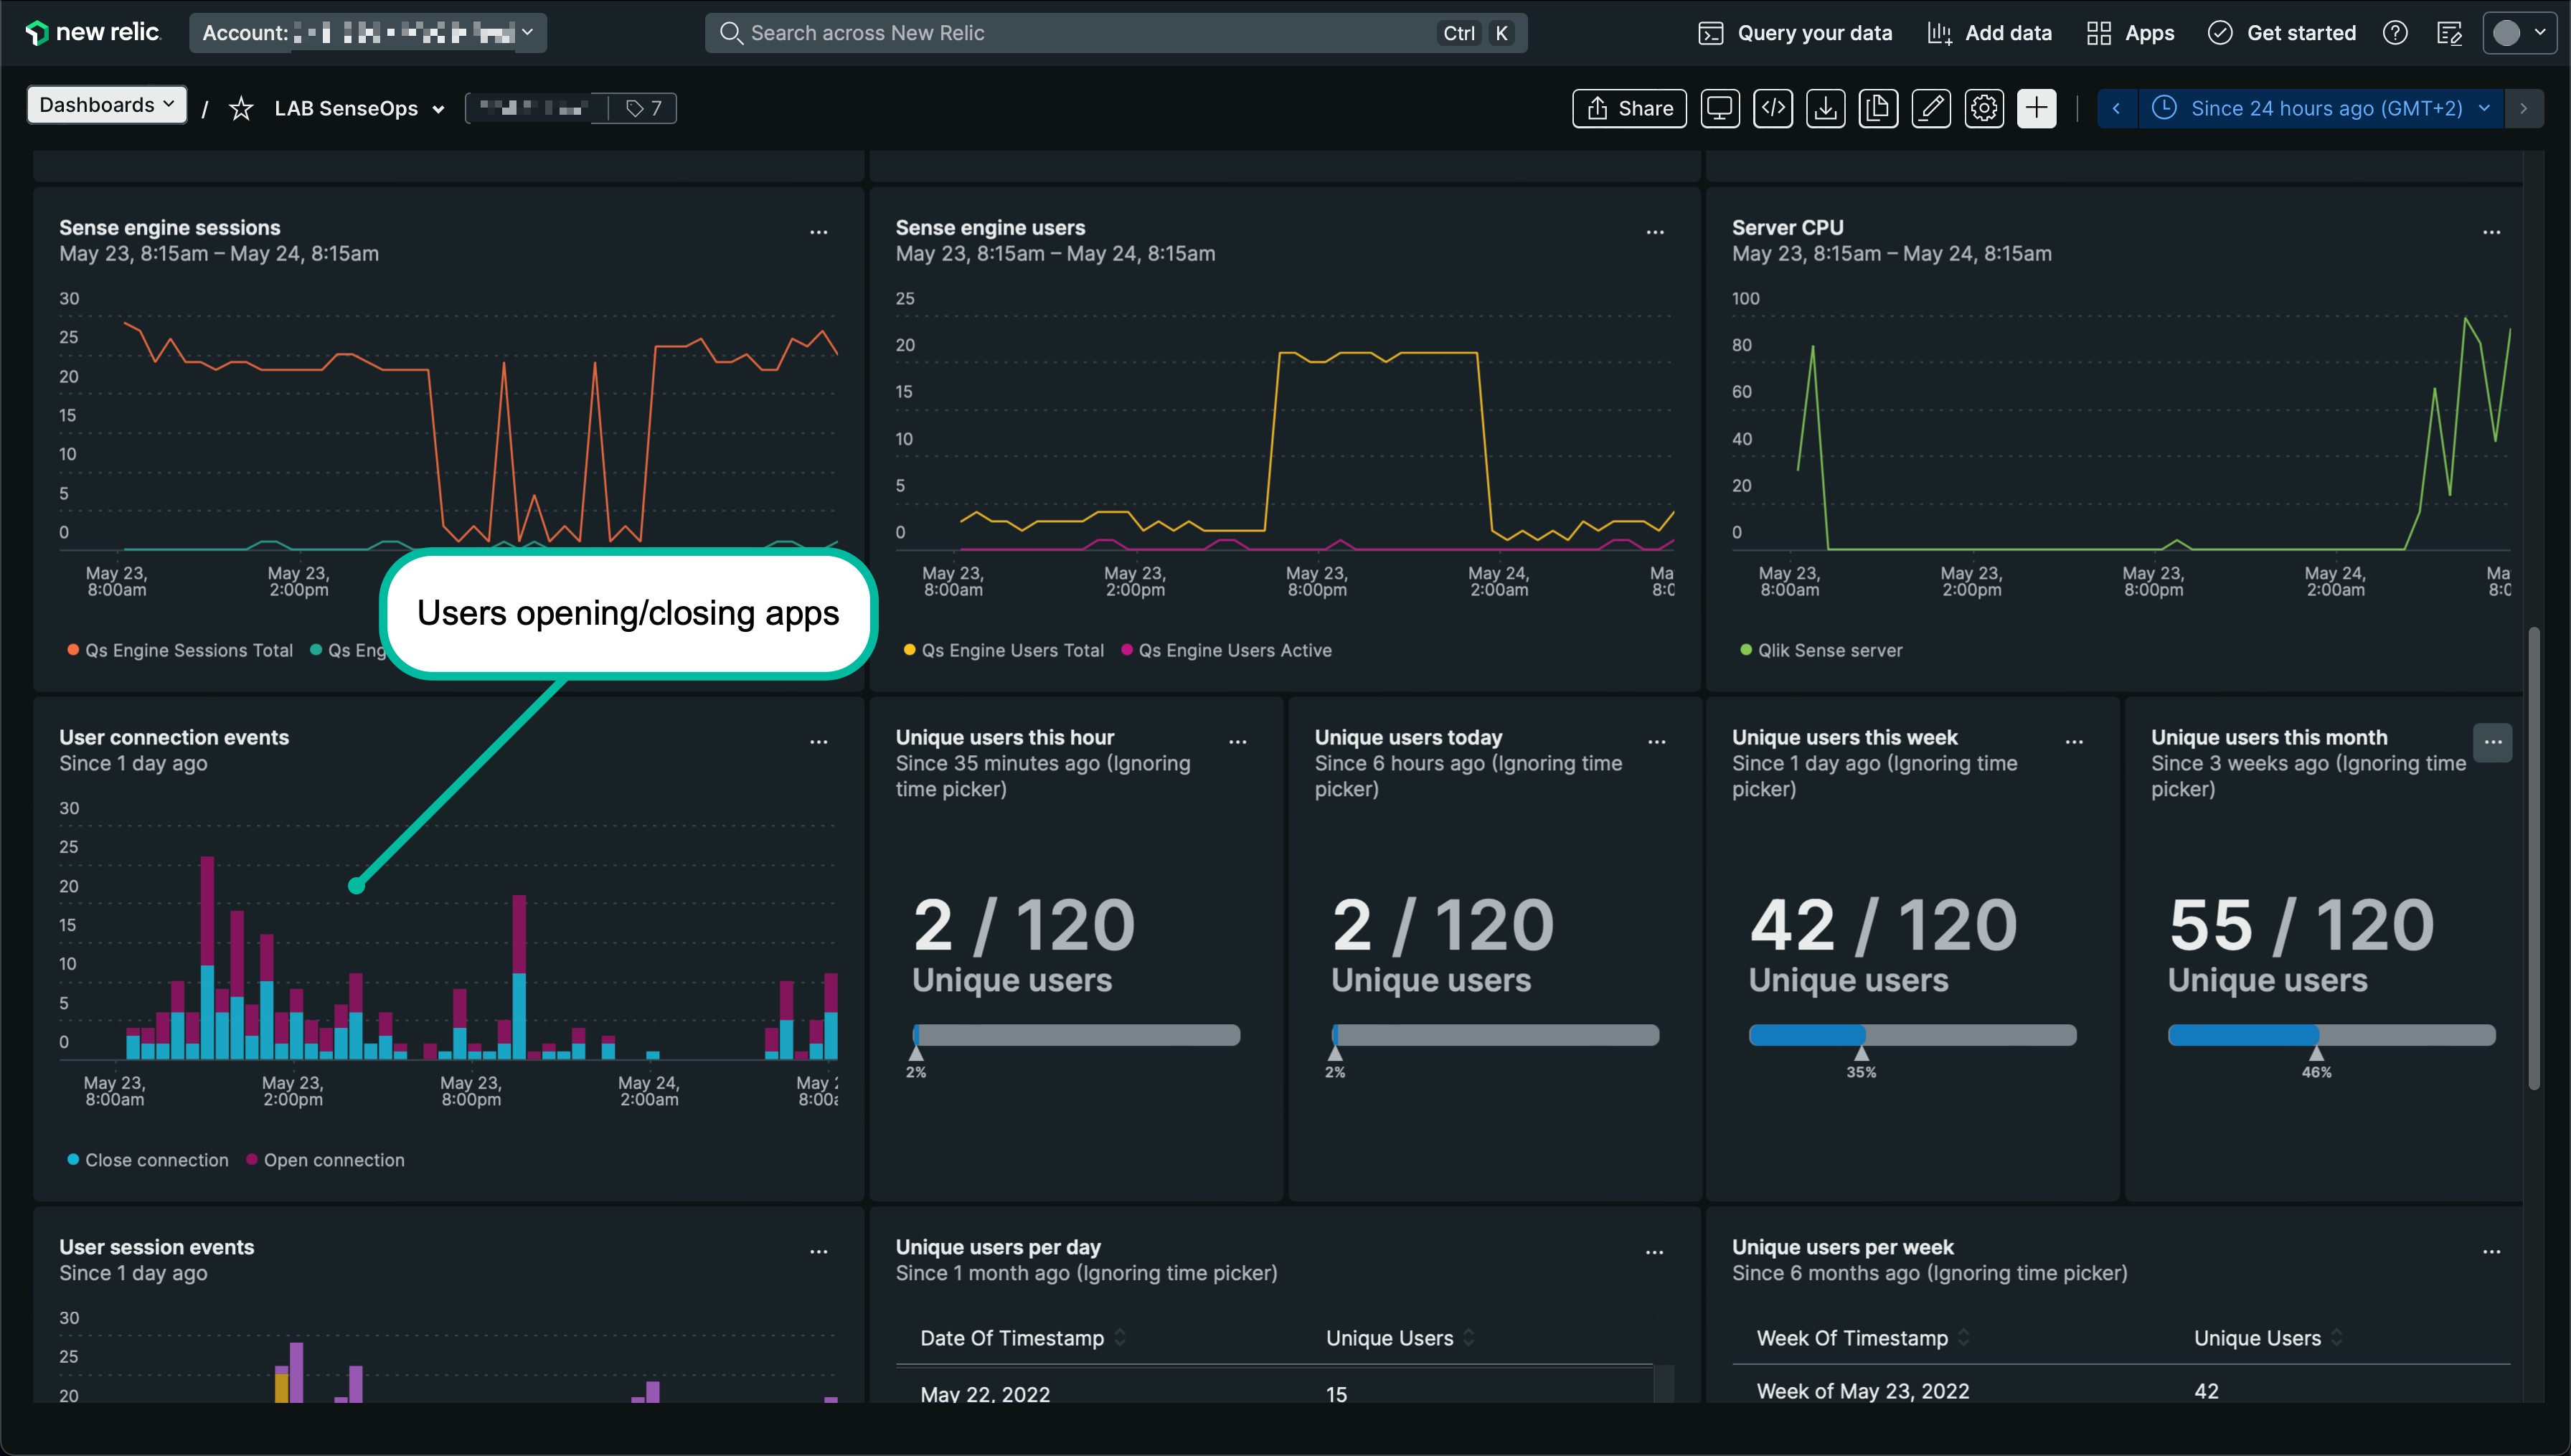
Butler SOS operational metrics integrated with New Relic
Incidents Overview
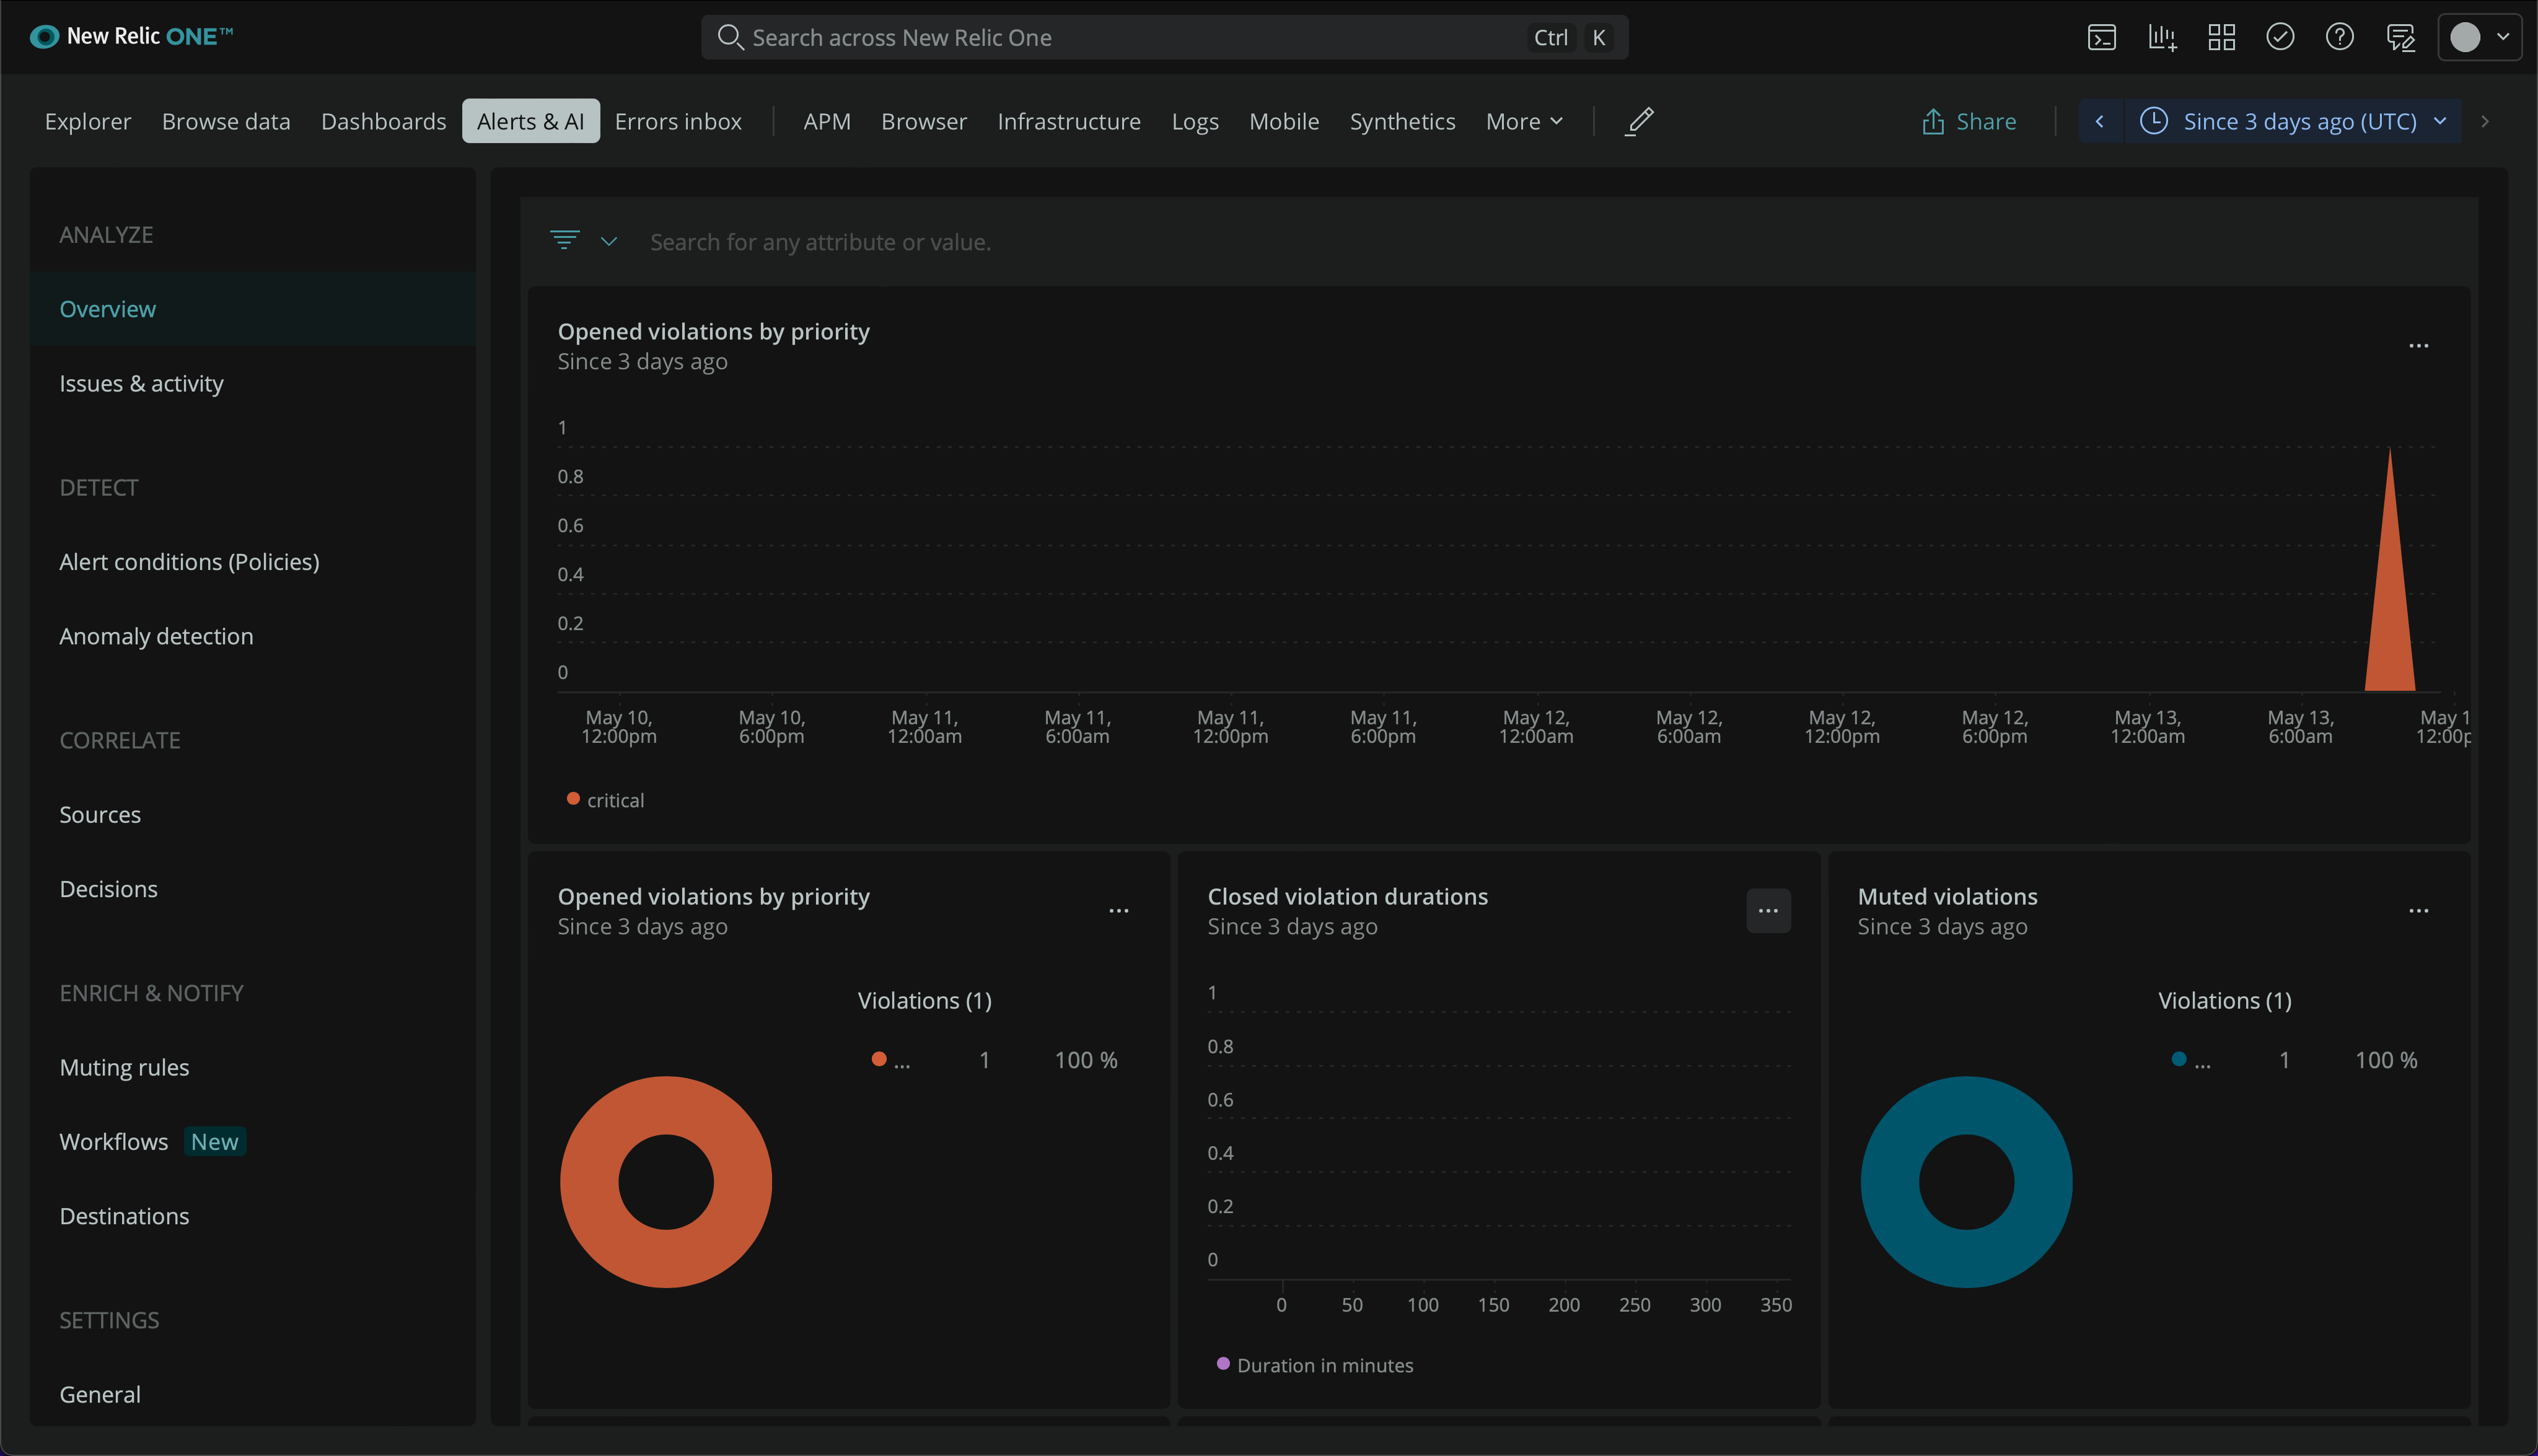
New Relic incidents overview showing alert history
Alert Conditions Management
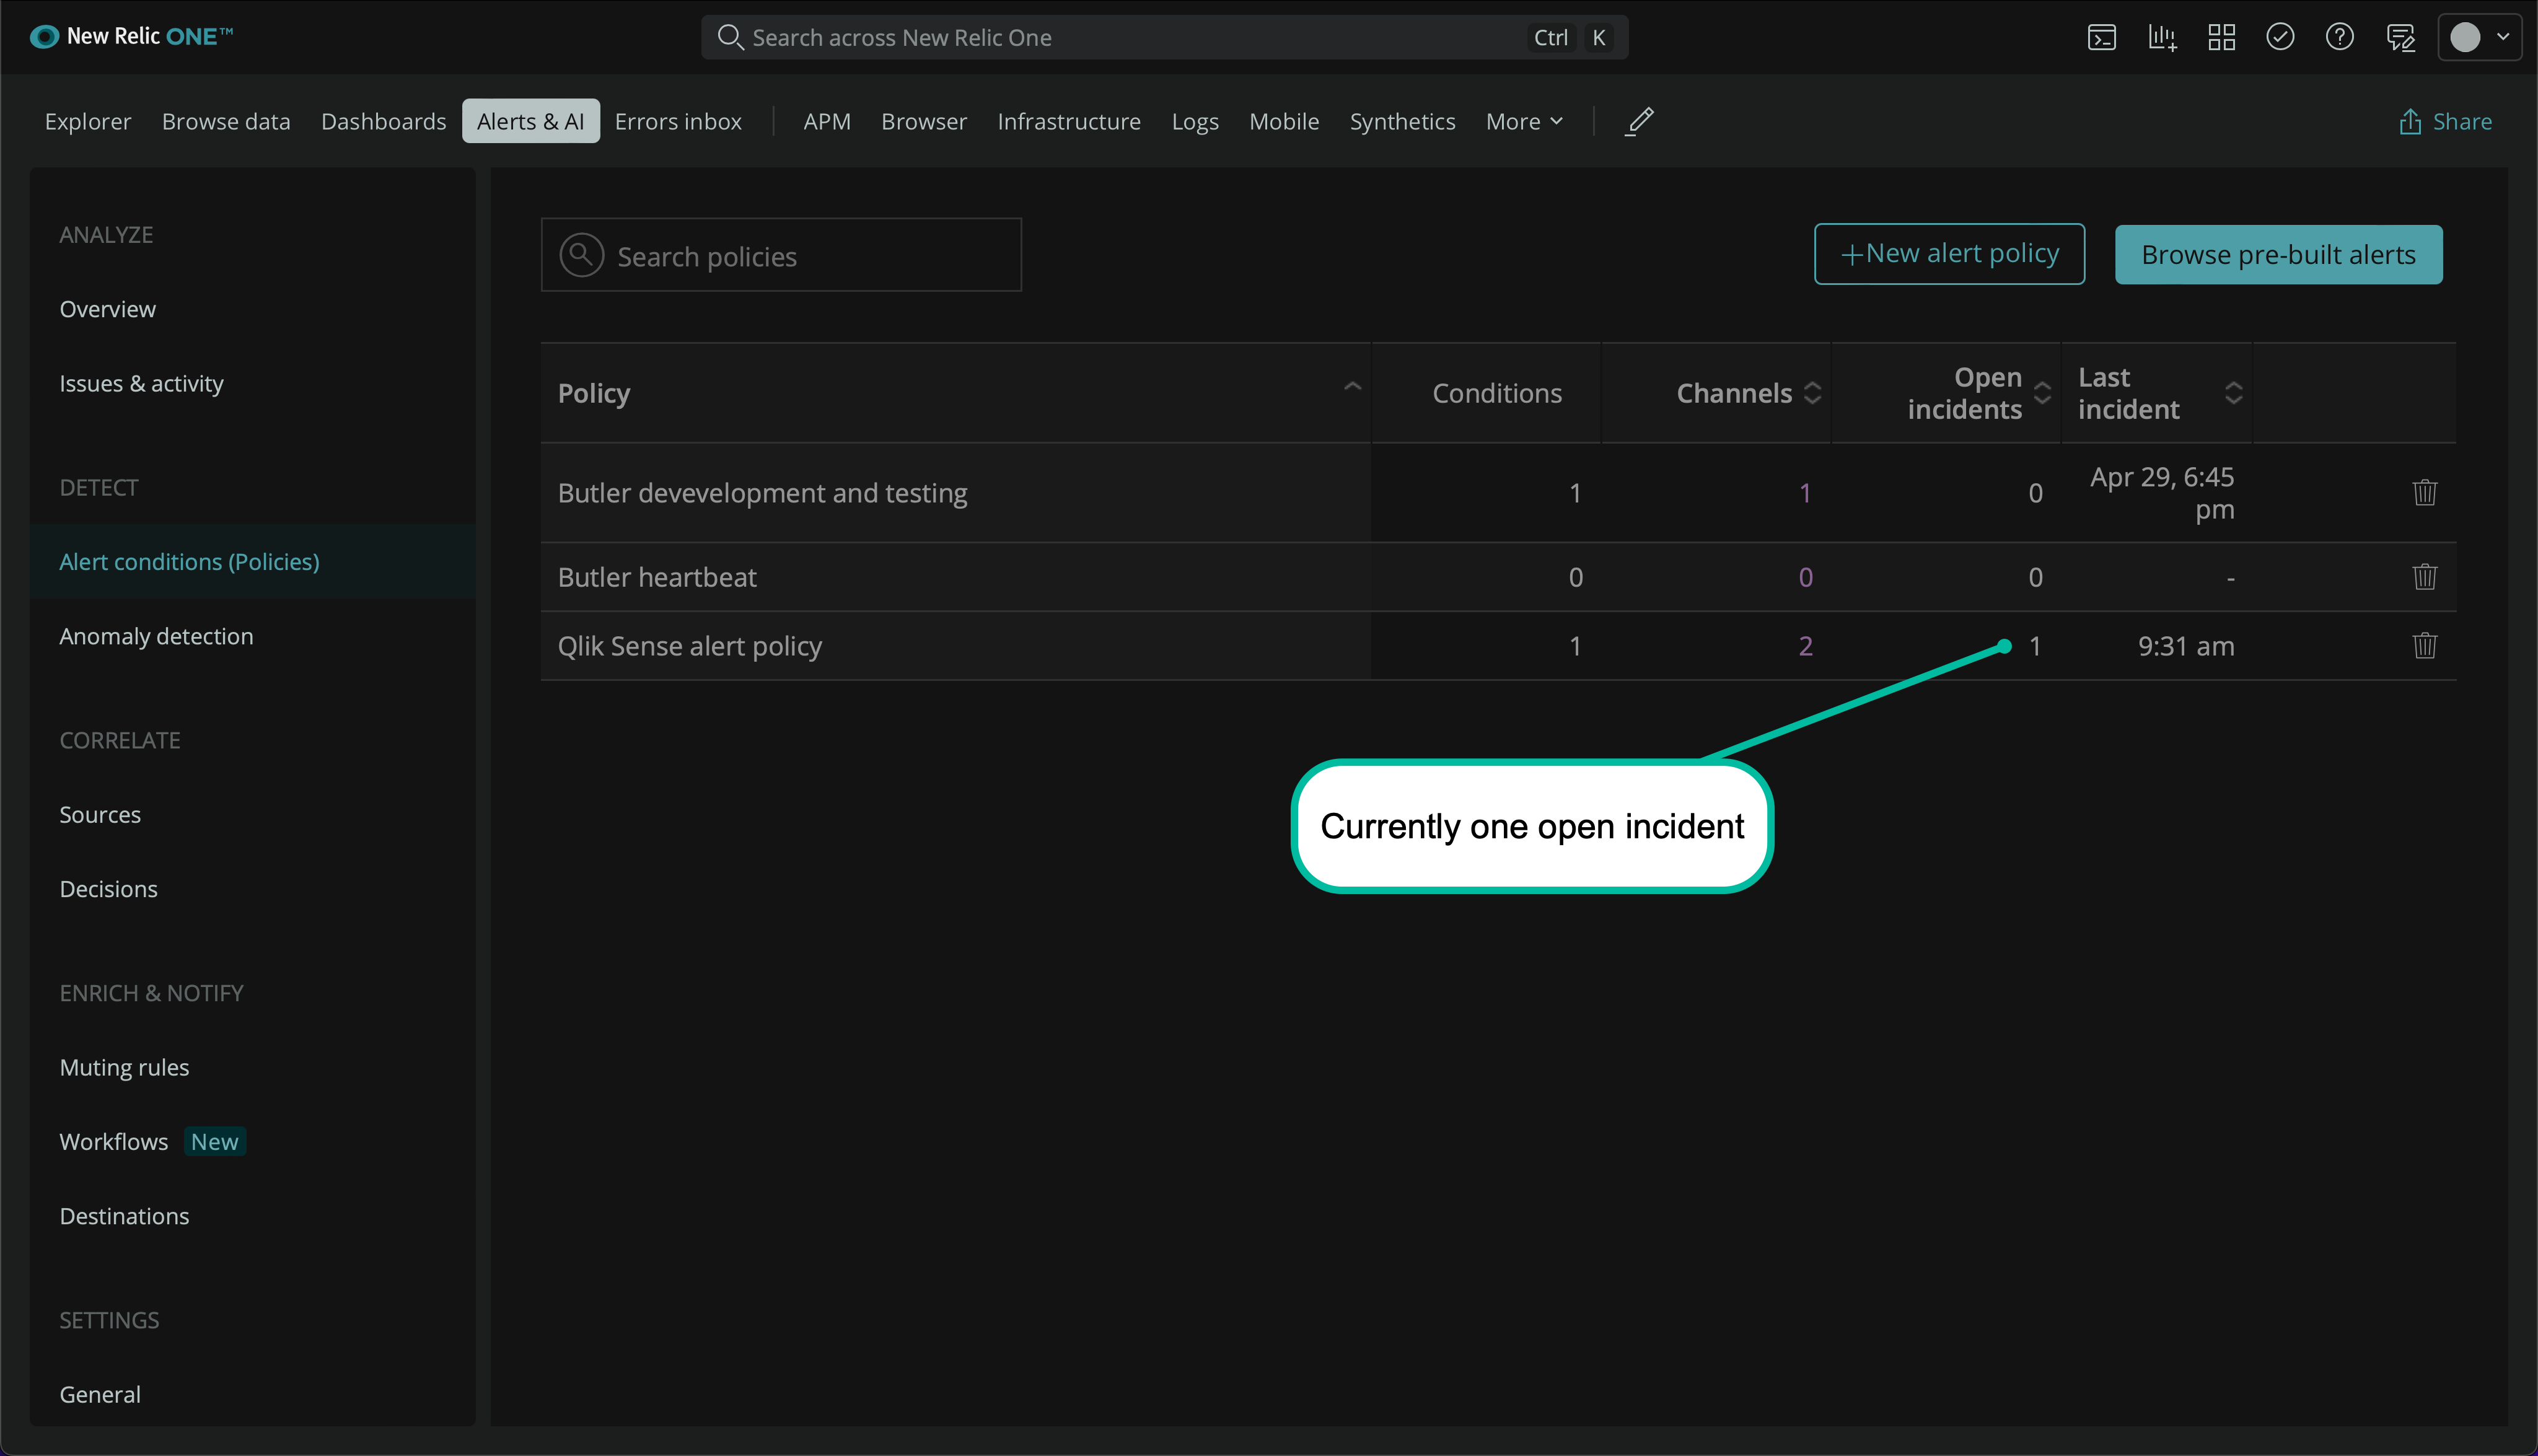
Configuration of alert conditions in New Relic
Slack Integration Examples
New Relic can send formatted alerts to Slack channels:
Basic Slack Alert
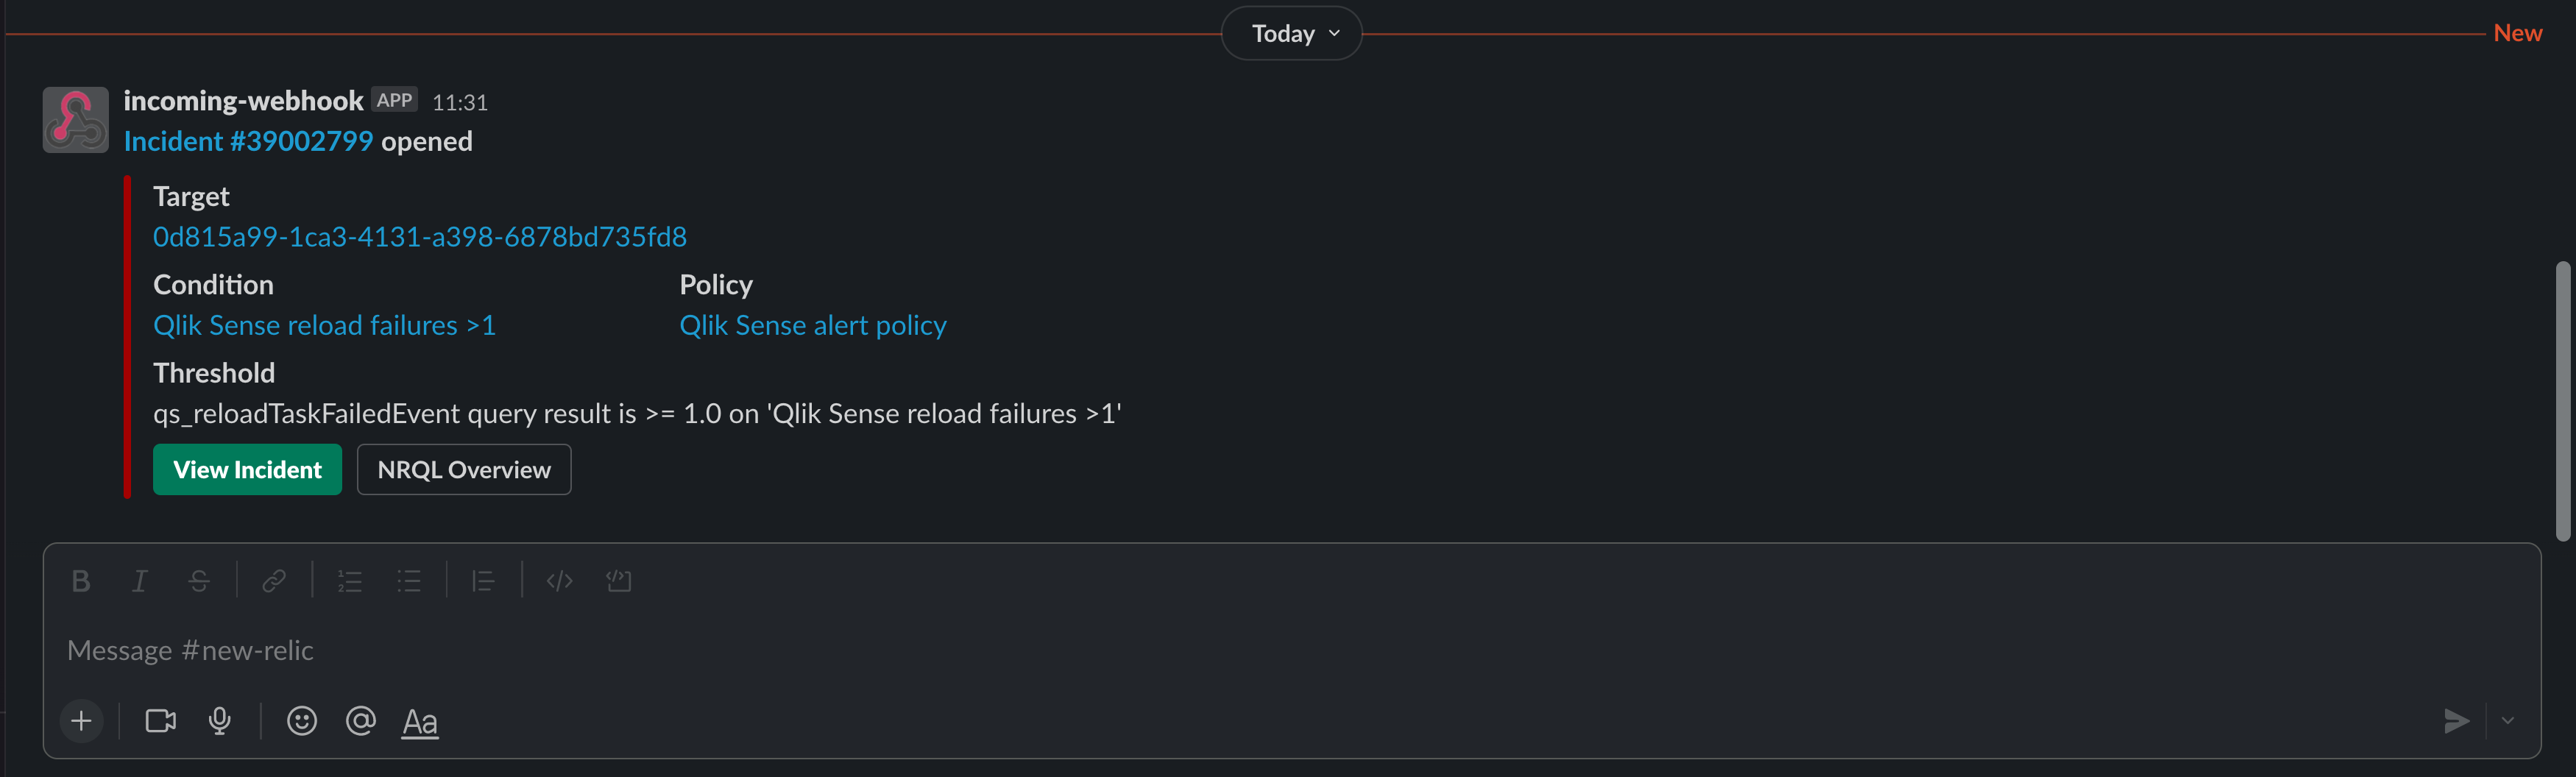
Basic New Relic alert notification in Slack
Comprehensive Slack Alert
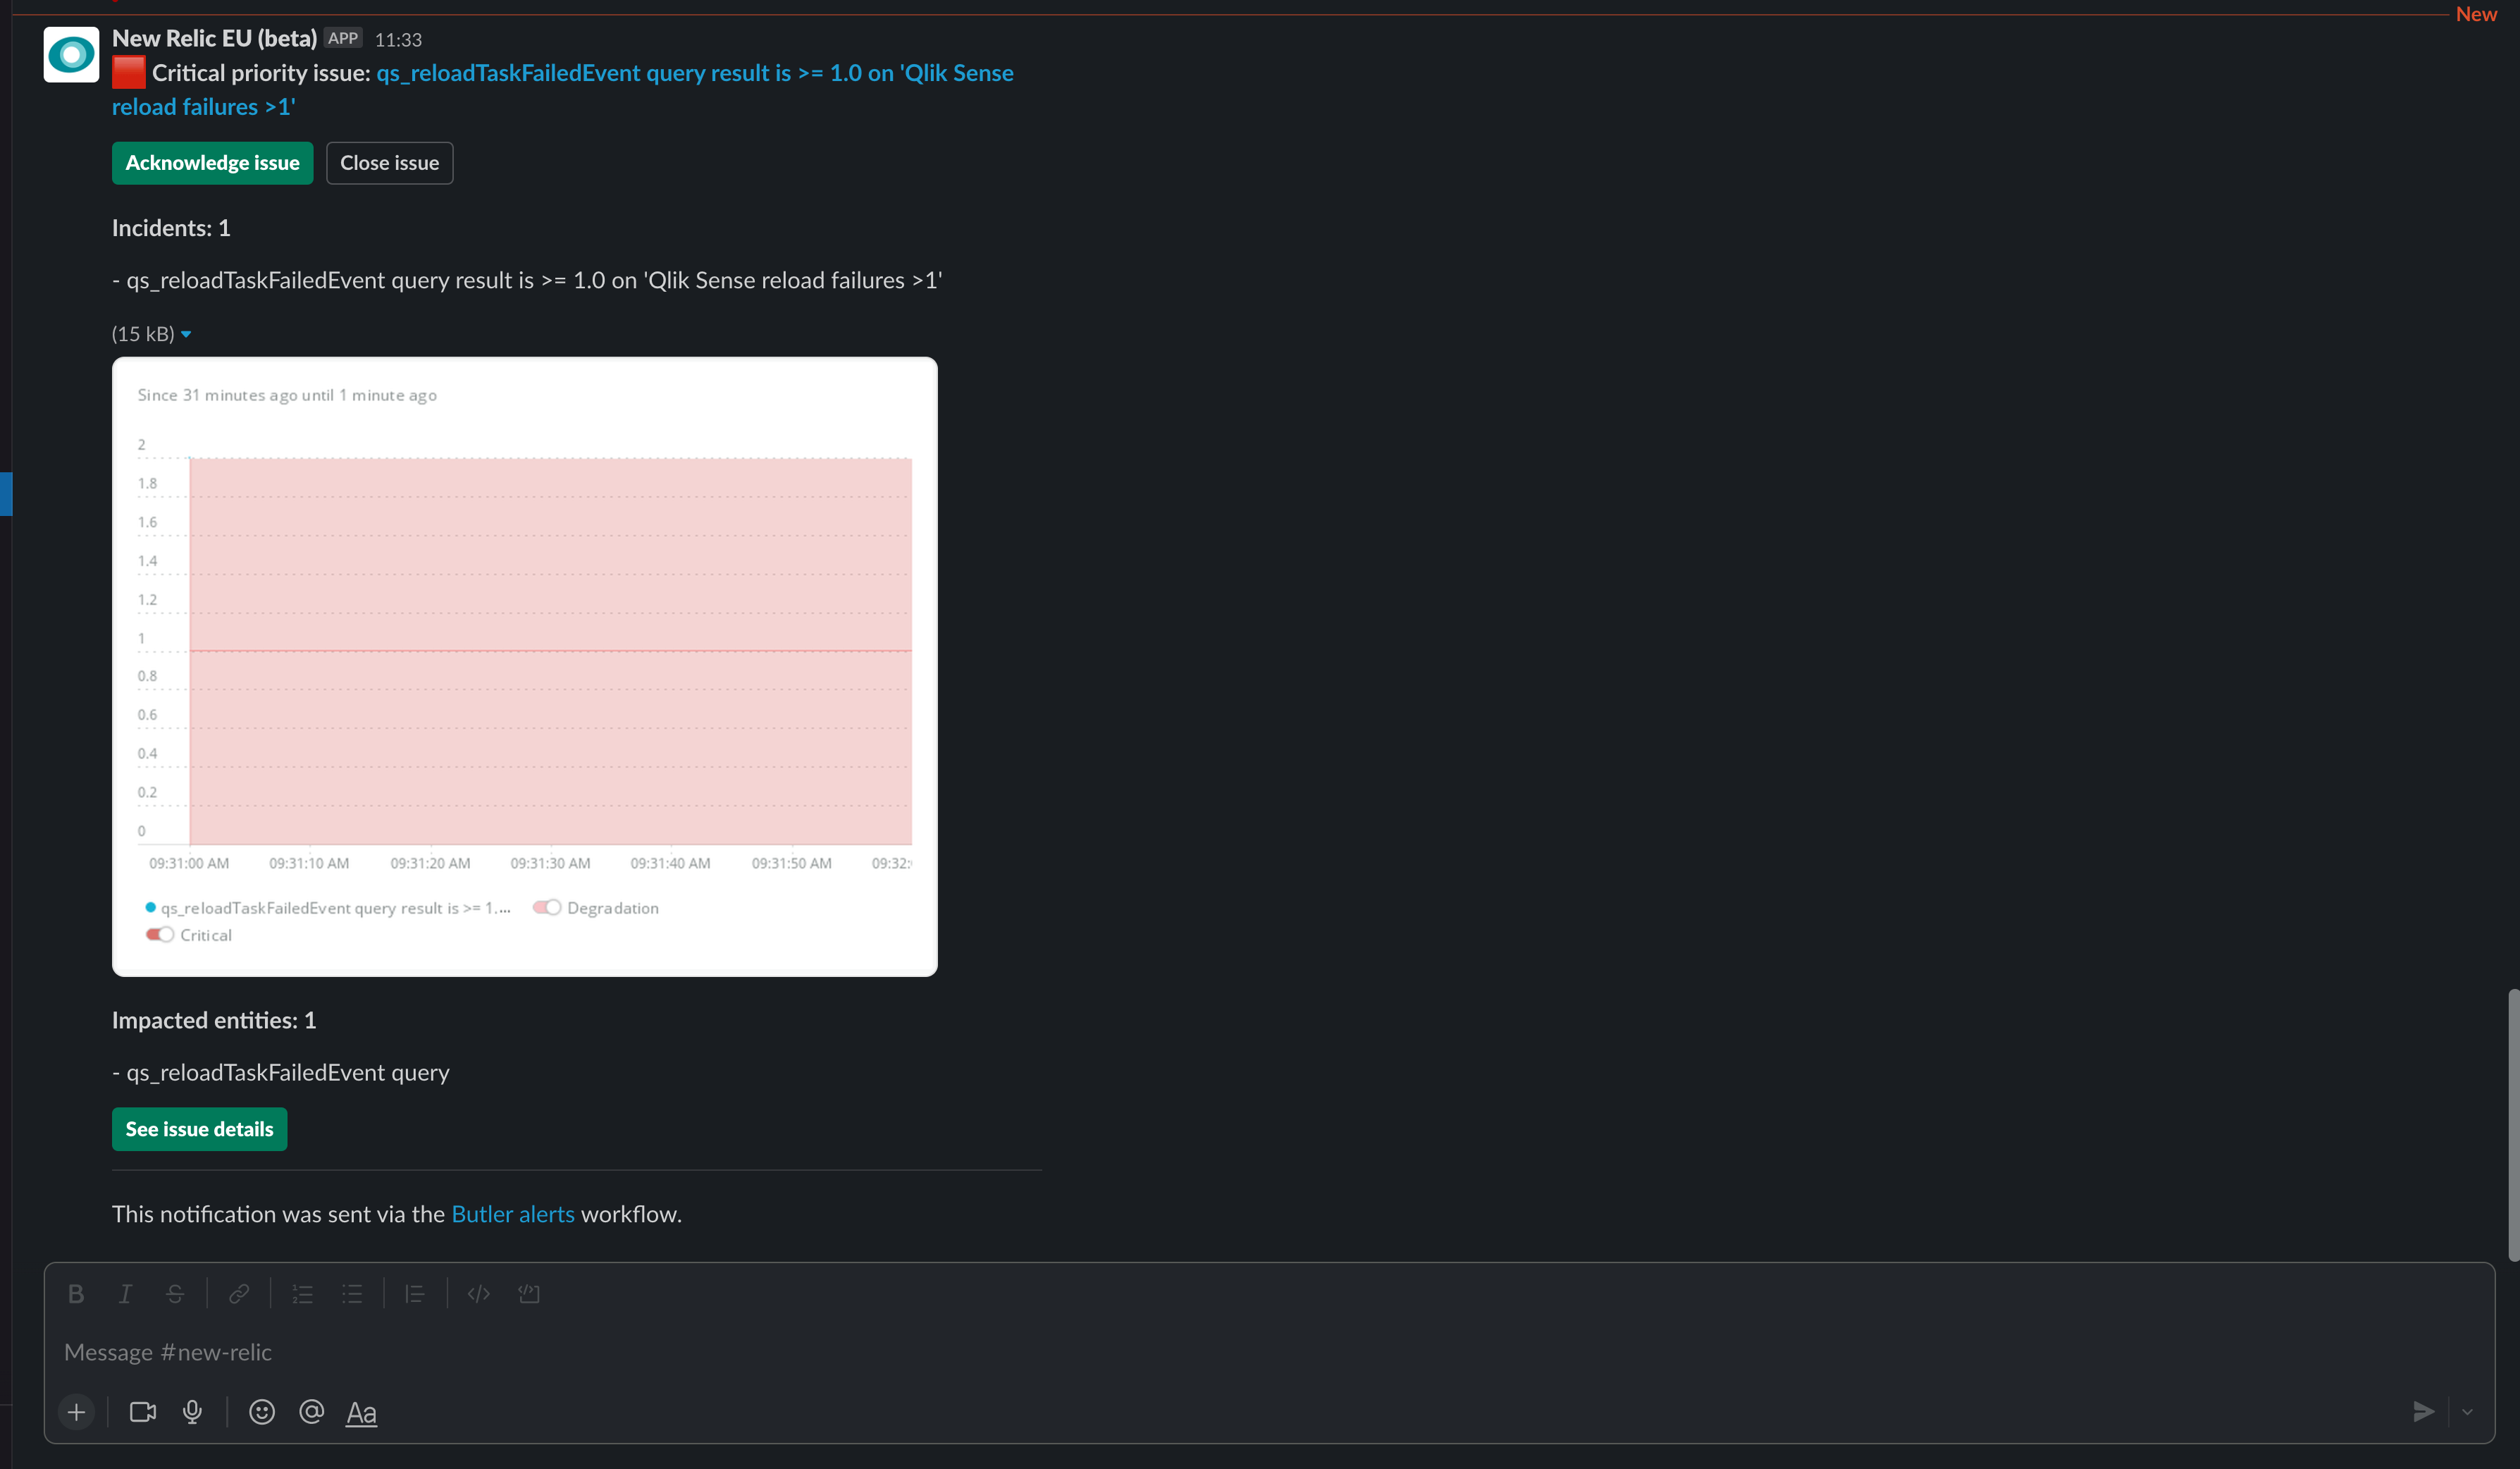
Comprehensive New Relic alert with detailed information in Slack
Configuration Requirements
New Relic Setup
- Account Creation: Create New Relic account (free tier available)
- API Keys: Generate Insert API key for events ingestion
- Alert Policies: Create policies for different severity levels
- Notification Channels: Configure Slack, Teams, email, or PagerDuty
- Dashboards: Import or create Butler-specific dashboards
Best Practices
Event Design
Consistent Schema: Use standardized event structures across all Butler integrations
Rich Metadata: Include enough context for immediate triage:
- Application business purpose
- Error details and classifications
- Environmental context (prod/test/dev)
- Historical failure patterns
Severity Mapping: Align Butler severity levels with New Relic incident priorities
Alert Policy Strategy
Tiered Policies:
- Critical: Repository/Engine services, database connectivity
- High: Business-critical app failures, license issues
- Medium: Non-critical app failures, performance degradation
- Low: Informational events, recovery notifications
Notification Channels:
- Immediate: PagerDuty for critical issues
- Standard: Slack/Teams for business hours
- Delayed: Email for non-urgent issues
Dashboard Organization
Executive View: High-level KPIs and trend analysis Operations View: Real-time system health and active incidents Technical View: Detailed metrics and troubleshooting data Historical View: Trend analysis and capacity planning
Cost Management
Data Ingestion
- Event Volume: Monitor Butler event generation rates
- Retention Policies: Set appropriate data retention periods
- Sampling: Use sampling for high-volume, low-priority events
- Compression: Optimize event payload sizes
Free Tier Optimization
What is included in New Relic's free tier may differ over time.
Regularly review your usage against the free tier limits to avoid unexpected costs.
Troubleshooting
Common Issues
Events Not Appearing:
- Verify API key permissions and region
- Check Butler logs for API errors
- Validate event payload format
- Monitor New Relic API rate limits
Alerts Not Firing:
- Review NRQL query syntax
- Check alert condition thresholds
- Verify event data structure
- Test alert conditions manually
Missing Notifications:
- Verify notification channel configuration
- Check escalation policies
- Test notification channels independently
- Review incident management workflow
Getting Started
- Create New Relic Account: Start with the free tier
- Generate API Keys: Create Insert API key for Butler integration
- Configure Butler: Enable New Relic integration with basic settings
- Test Integration: Trigger test events to verify data flow
- Create Alert Conditions: Set up basic failed reload alerts
- Add Notification Channels: Configure Slack, Teams, or email alerts
API Rate Limits
New Relic has API rate limits that Butler respects. For high-volume environments, consider:
- Event batching and compression
- Filtering non-critical events
- Using appropriate severity levels
- Monitoring API usage in New Relic
Next Steps
- Setup Guide - Step-by-step configuration
- Alert Templates - Customize event payloads
- Butler SOS Integration - Complete observability stack