Windows Services Monitoring
Monitor Windows services across multiple servers and get alerted when services stop or start.
Windows Only
Butler can be installed on several different platforms, but the Windows service monitoring feature will only work when Butler is installed on a Windows computer.
Overview
If a Sense service stops unexpectedly, end users will be impacted immediately. Apps may stop reloading, users may lose access to the hub or QMC, or other critical functions may become unavailable.
Many organizations rely on dedicated infrastructure teams for monitoring, but in smaller environments, the same team that develops and maintains Sense apps often handles system monitoring. For these teams, immediate notification when services fail is crucial.
Butler provides comprehensive Windows service monitoring with support for:
- Multiple Servers: Monitor services across your entire Qlik Sense deployment
- Multiple Services: Track any Windows service, not just Qlik Sense services
- Real-time Alerts: Get notified immediately when service states change
- Multiple Destinations: Send alerts to Slack, Teams, email, webhooks, InfluxDB, New Relic, and MQTT
Grafana Integration
Butler can send service status data to InfluxDB, enabling powerful Grafana dashboards and alerting.
Service Timeline Visualization
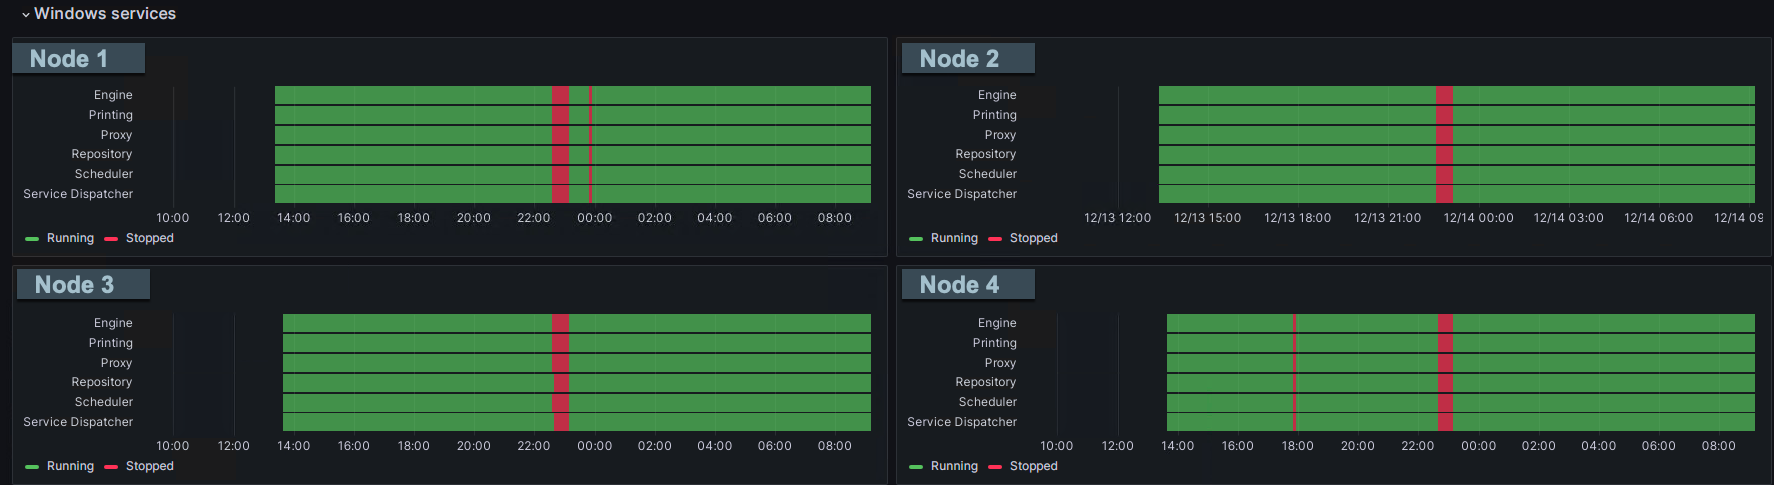
Grafana state timeline showing Qlik Sense service status across 4 servers over time
This Grafana "state timeline" chart shows Qlik Sense service status across 4 servers over time. The red bars indicate when all services were restarted, with additional shorter outages visible on some servers.
Advanced Alerting
With service data in InfluxDB, you can create Grafana alerts that trigger when services stop, automatically sending notifications to:
- Incident Management: PagerDuty, OpsGenie, VictorOps
- Communication: Slack, Teams, email
- Custom Integrations: Webhooks for any external system
Service State Management
Butler uses an internal state machine to track service status and detect changes:
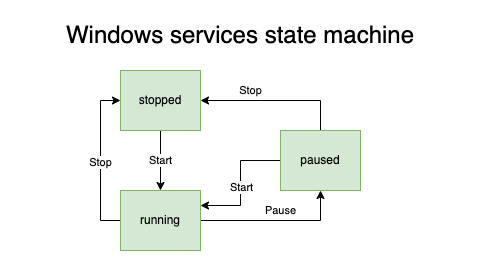
State machine diagram showing service state transitions
Alert Triggers
Butler sends alerts only when service states change, preventing notification spam while ensuring you're informed of every important event.
State Persistence
The state machine is not persisted to disk. If Butler restarts, it will not remember previous service states and will re-establish baseline status on the next monitoring cycle.
Performance Considerations
Sequential Execution
Service checks are executed sequentially, which means:
- Multiple servers + services = longer check cycles
- Remote servers add network latency
- Plan check frequency accordingly
Network Connectivity
Remote server monitoring requires WMI (Windows Management Instrumentation) connectivity. For best results:
- Firewall Configuration: Ensure WMI ports are open
- Authentication: Run Butler with appropriate permissions
- Network Latency: Consider round-trip time in your monitoring frequency
Permissions and Security
Local Monitoring
For services on the same server as Butler, standard service query permissions are sufficient.
Remote Monitoring
To monitor services on remote servers, the Butler service account needs:
- Local Administrator: Easiest approach - add Butler's account to local Administrators group on each monitored server
- WMI Permissions: More secure - grant specific WMI query permissions
- Network Access: Ensure firewall allows WMI connectivity
Security Best Practice
While local Administrator membership is the simplest approach, consider implementing least-privilege access using specific WMI permissions for production environments.
Frequency Configuration
The monitoring frequency uses Later.js syntax:
# Every 5 minutes
frequency: every 5 minutes

# Every 30 seconds
frequency: every 30 seconds

# Every hour at minute 15
frequency: at 15 minutes past every hour

# Every day at 2:30 AM
frequency: at 2:30 am
Common Service Names
Qlik Sense Services
services:
  - name: QlikSenseEngineService
    friendlyName: Engine
  - name: QlikSensePrintingService
    friendlyName: Printing
  - name: QlikSenseProxyService
    friendlyName: Proxy
  - name: QlikSenseRepositoryService
    friendlyName: Repository
  - name: QlikSenseSchedulerService
    friendlyName: Scheduler
  - name: QlikSenseServiceDispatcher
    friendlyName: Service Dispatcher
Database Services
services:
  - name: postgresql-x64-12
    friendlyName: PostgreSQL Repository DB
  - name: MSSQLSERVER
    friendlyName: SQL Server
  - name: SQLSERVERAGENT
    friendlyName: SQL Server Agent
Web Services
services:
  - name: W3SVC
    friendlyName: IIS Web Service
  - name: WAS
    friendlyName: Windows Process Activation
Use Cases
Proactive Monitoring
- Service Failure Detection: Immediate alerts when critical services stop
- Recovery Confirmation: Notifications when services restart successfully
- Maintenance Windows: Monitor service states during planned maintenance
Capacity Management
- Resource Planning: Historical service uptime data for SLA reporting
- Performance Correlation: Correlate service restarts with performance issues
- Trend Analysis: Identify services that restart frequently
Integration Scenarios
- Incident Management: Create tickets automatically when services fail
- Dashboard Updates: Real-time service status on monitoring dashboards
Best Practices
- Start Small: Begin monitoring core services on primary servers
- Set Appropriate Frequency: Balance monitoring speed with system load
- Use Rate Limiting: Prevent notification spam during service instability
- Monitor Dependencies: Include database and web services, not just Qlik Sense
- Test Connectivity: Verify WMI access to all monitored servers before going live