New Relic
They offer a uniform approach to dealing with metrics, logs and events - including a basic but working alert management feature.
The service is easy to get started with and has a generous free tier that works well for testing Butler alerts.
New Relic is a good choice for both metrics storage and alerting as it handles both reload failure alerts generated by the Butler tool as well as operational metrics from Butler SOS.
New Relic is not primarily an incident management tool, but rather a complete SaaS platform for handling metrics, logs, events and trace messages.
Their event handling however has some alert handling features built in, and these can be nicely integrated with Butler and Qlik Sense.
Furthermore, New Relic also integrates with several dedicated incident management tools (PagerDuty, VictorOps, OpsGenie and others) and also other notification channels such as Slack, Teams, email, and generic webhooks.
Together these capabilities makes New Relic a very good match to the features offered by Butler and Butler SOS.
The concept looks like this:
- Alerts (for example a reload task fails in Qlik Sense) are sent to New Relic using their event and log APIs.
Butler integrates tightly with those APIs, creating a seamless, almost instantaneous forwarding of incidents. - Metadata about the failed or aborted reload task and associate Sense app is sent to New Relic together with the last parts of the reload script log.
The script log can then be viewed from within New Relic’s web interface and usually provides instant insight into what caused the reload to fail. - As part of the setup process, “alert conditions” are created in New Relic. These define when New Relic alerts should be created, given the event data sent from Butler.
- New Relic “alert policies” are used to group together several conditions and also associate notification channels (Slack, Teams, PagerDuty, …) to each alert policy.
- New Relic incidents stay in an open state until they are acknowledged, which can be done from the web interface or from within email or Teams/Slack messages.
The Getting started section has hands-on instructions for setting up Butler to work with New Relic.
New Relic screen shots
Sample New Relics dashboards are found below.
Please note that some of the charts (server RAM, CPU, user sessions etc) in these dashboards use data from Butler SOS.
Butler provides data for failed/aborted reloads tables and charts.
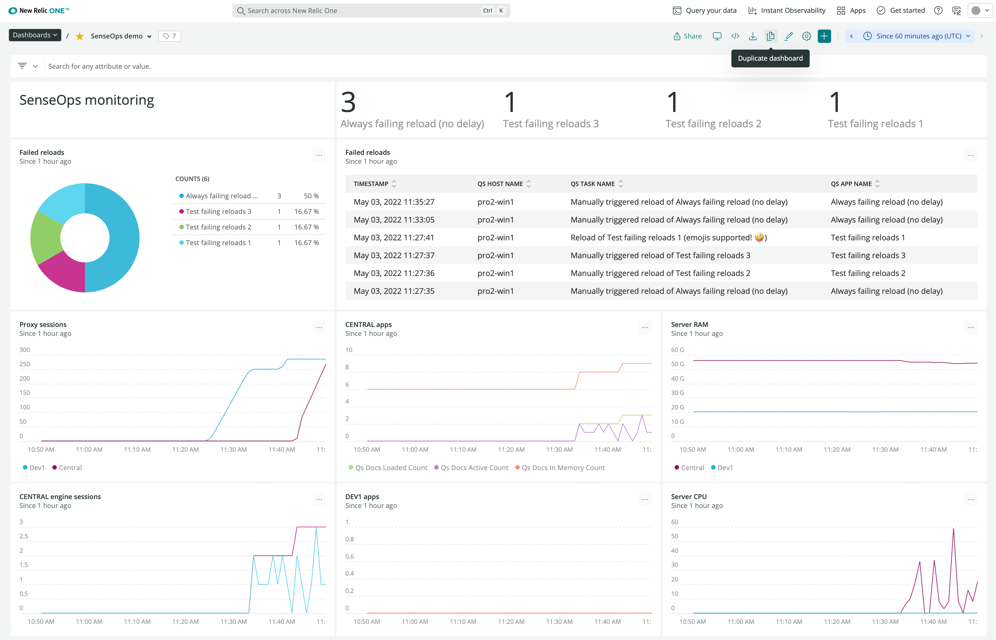
New Relic metrics & incident dashboard (light mode)
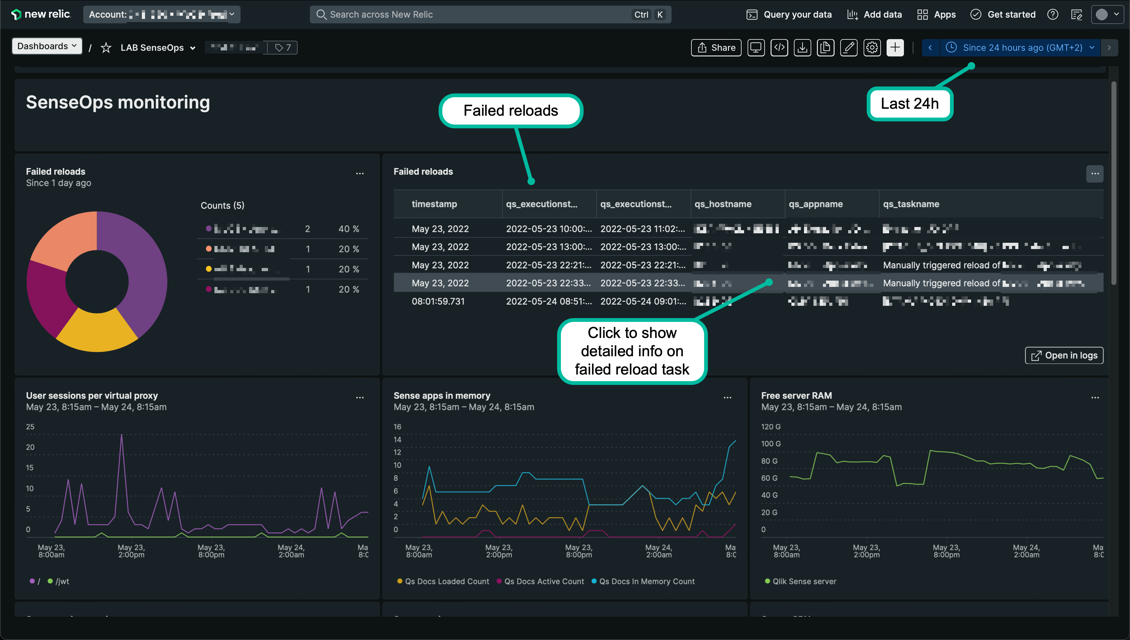
New Relic metrics & incident dashboard (dark mode, different time range than previous dashboard above).
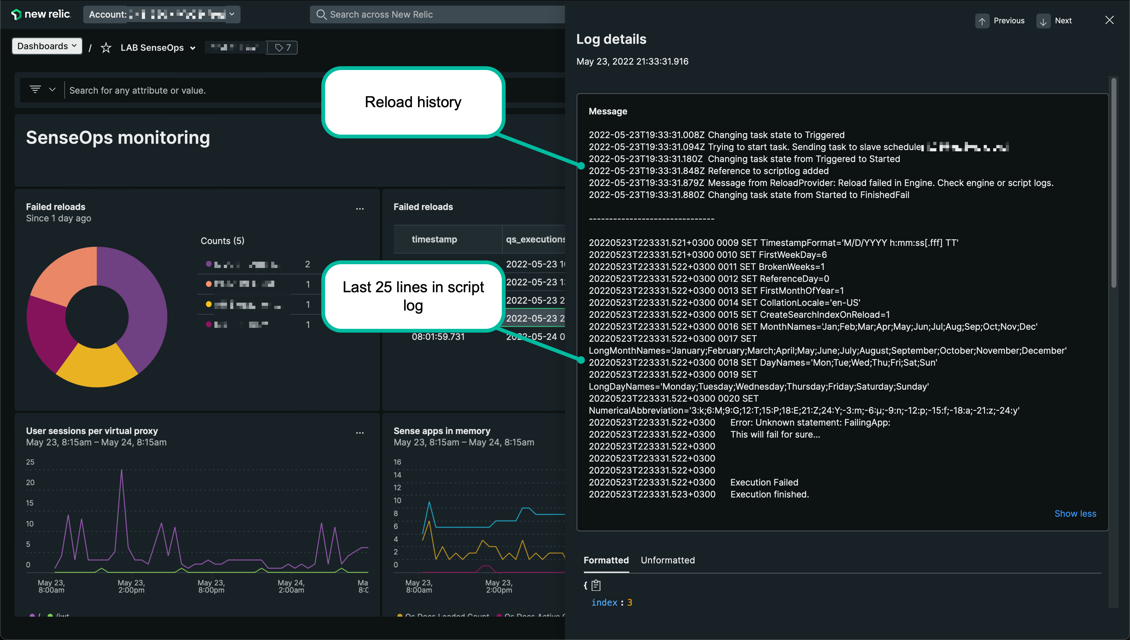
Detailed information about failed reloads, including the last part of the script log, is available from within New Relic dashboards.
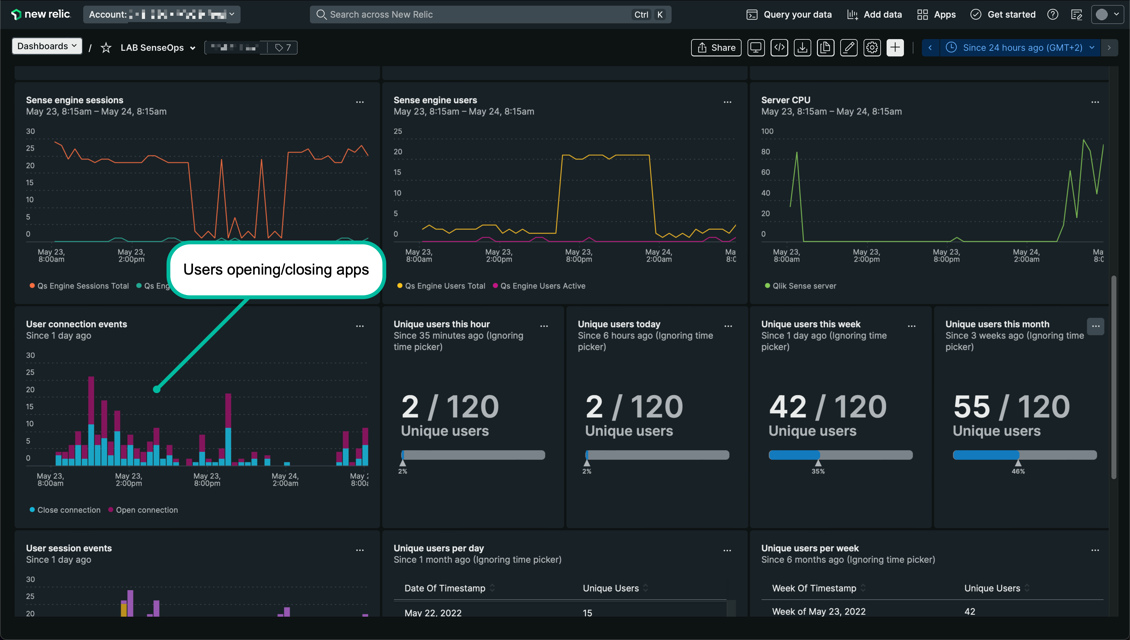
Butler SOS metrics in a dark mode New Relic dashboard.
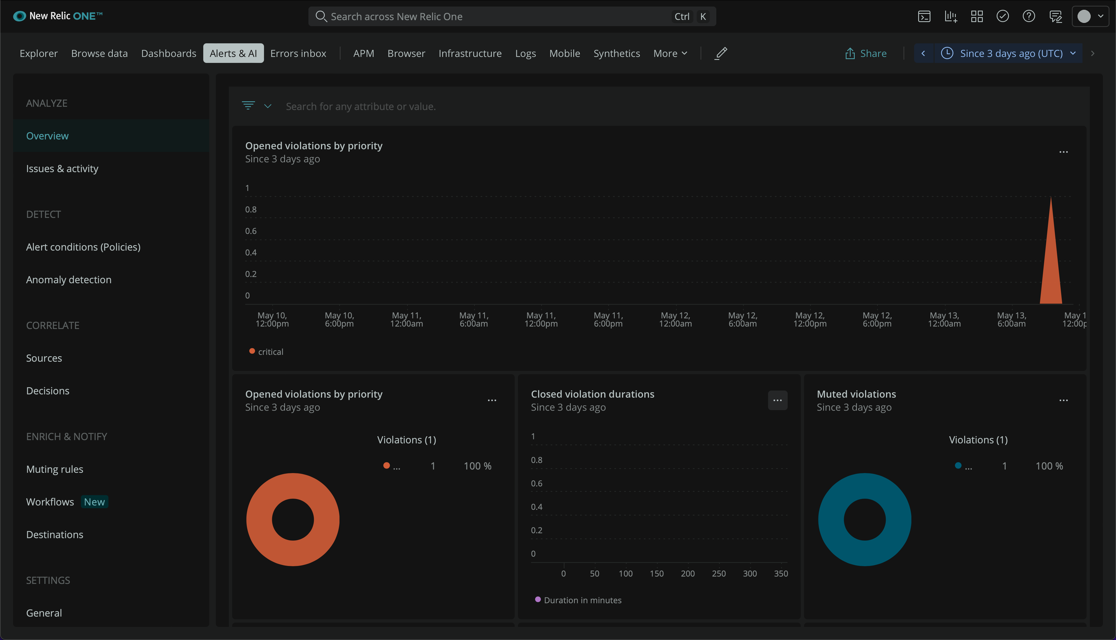
New Relic incidents overview page (dark mode)
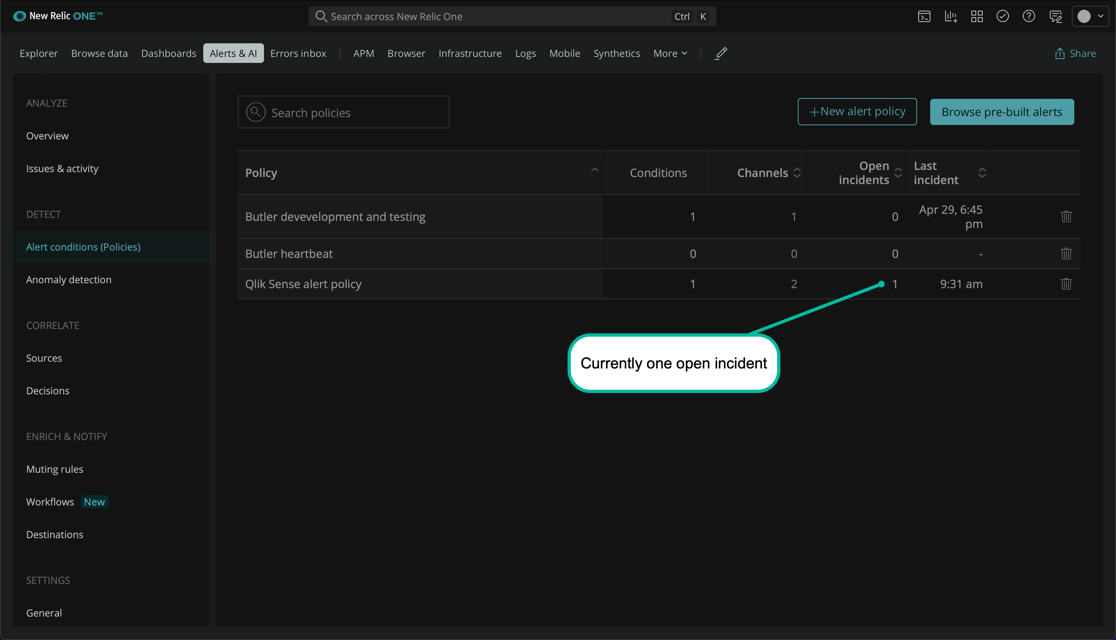
New Relic alert conditions (dark mode)
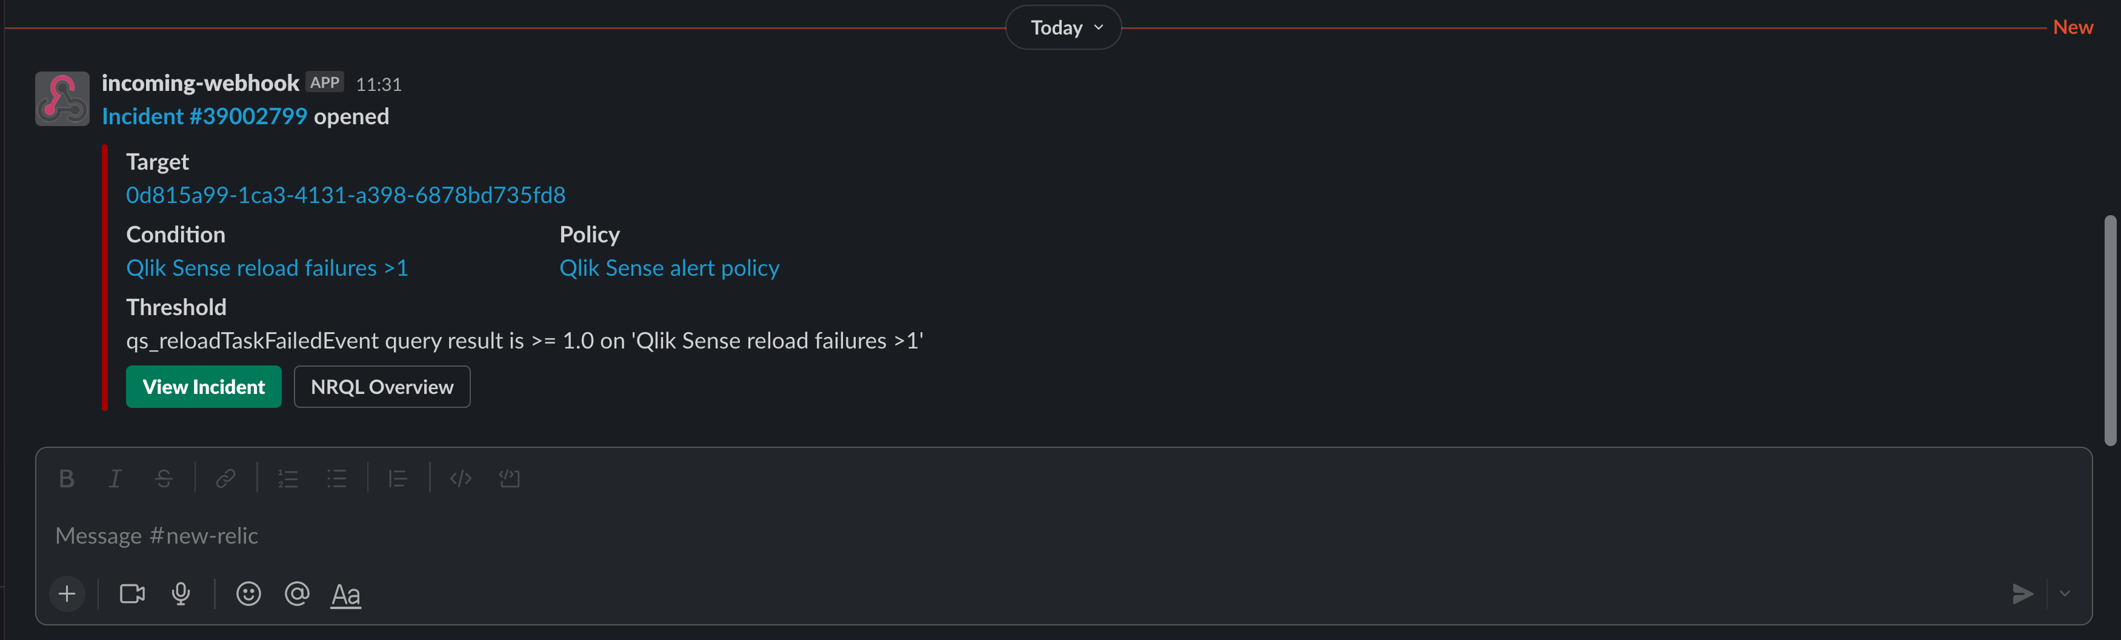
Basic New Relic Slack alert (dark mode)
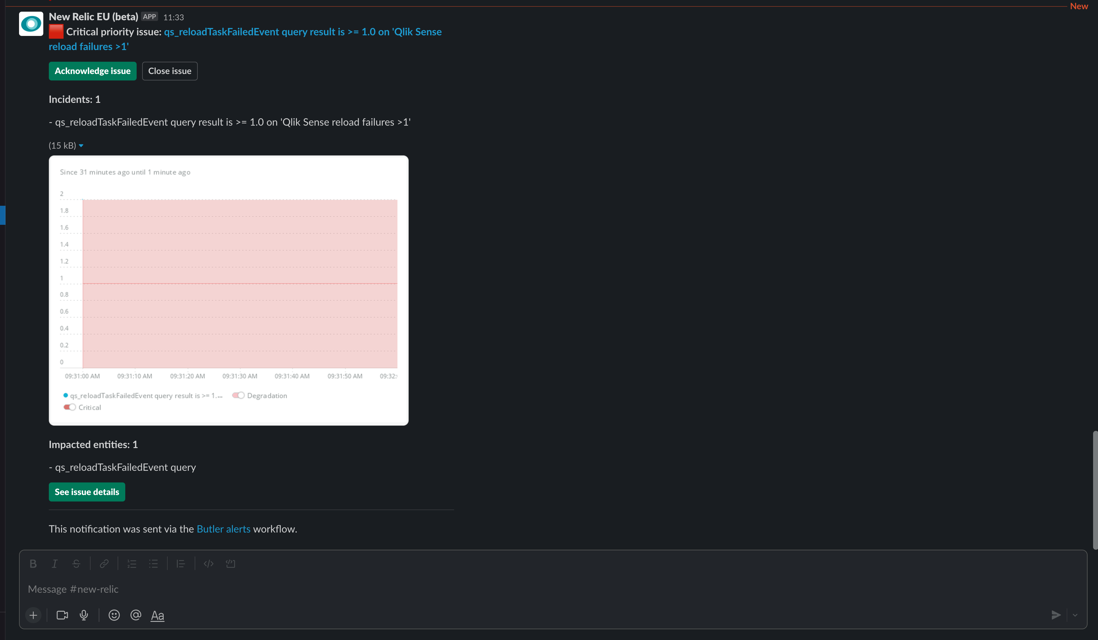
More comprehensive New Relic Slack alert (dark mode)