Day 2 operations
Options for running Butler.
Running Butler
How to start Butler varies depending on whether you run it as a standalone app, as a Docker container or as a Node.js app.
Monitoring Butler
Once Butler is running it's a good idea to also monitor it. Otherwise you stand the risk of not getting notified if Butler for some reason misbehaves.
Butler logs its own memory usage to the console and log files (if enabled), but can also send these metrics to an InfluxDB database and New Relic.
Butler will log its own memory usage to InfluxDB if
- The config file's
Butler.uptimeMonitor.enableandButler.uptimeMonitor.storeInInfluxdb.enableproperties are both set totrue. - The remaining InfluxDB properties of the config file are correctly configured.
Similarly, uptime metrics will be sent to New Relic if
- The config file's
Butler.uptimeMonitor.enableandButler.uptimeMonitor.storeNewRelic.enableproperties are both set totrue. - The remaining New Relic properties of the config file are correctly configured.
Assuming everything is correctly set up, you can then create a Grafana dashboard showing Butler's memory use over time, using data from InfluxDB. You can also set up alerts in Grafana if so desired, with notifications going to most IM tools and email.
A Grafana dashboard can look like this. Note that one of the available metrics (external) is not used in this particular dashboard. It's still logged to InfluxDB though.
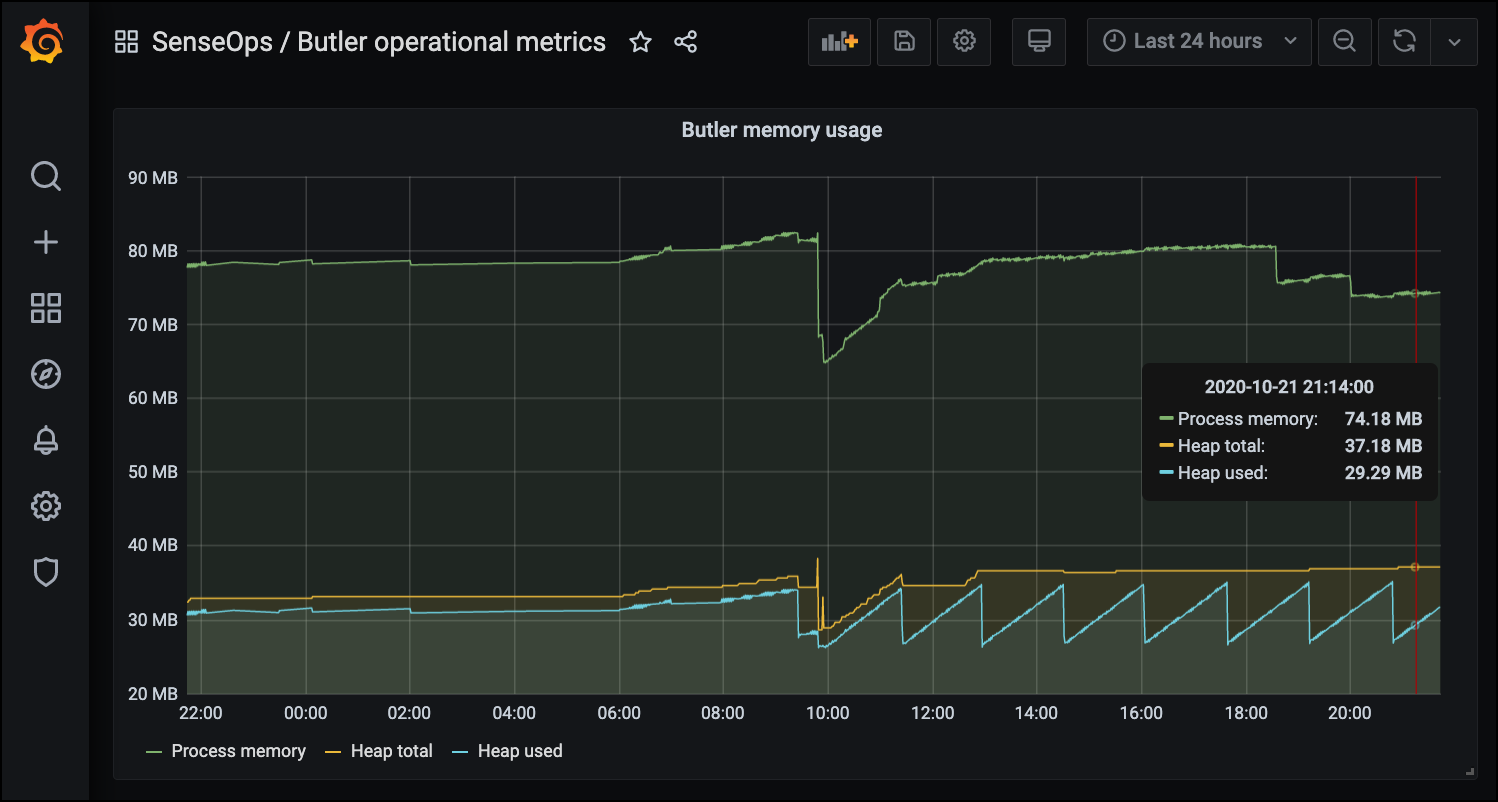
Butler memory usage in Grafana dashboard
There is a sample Grafana dashboard in Butler's GitHub repo.
A New Relic graph covering the same information (but a different time range!) can look like this:
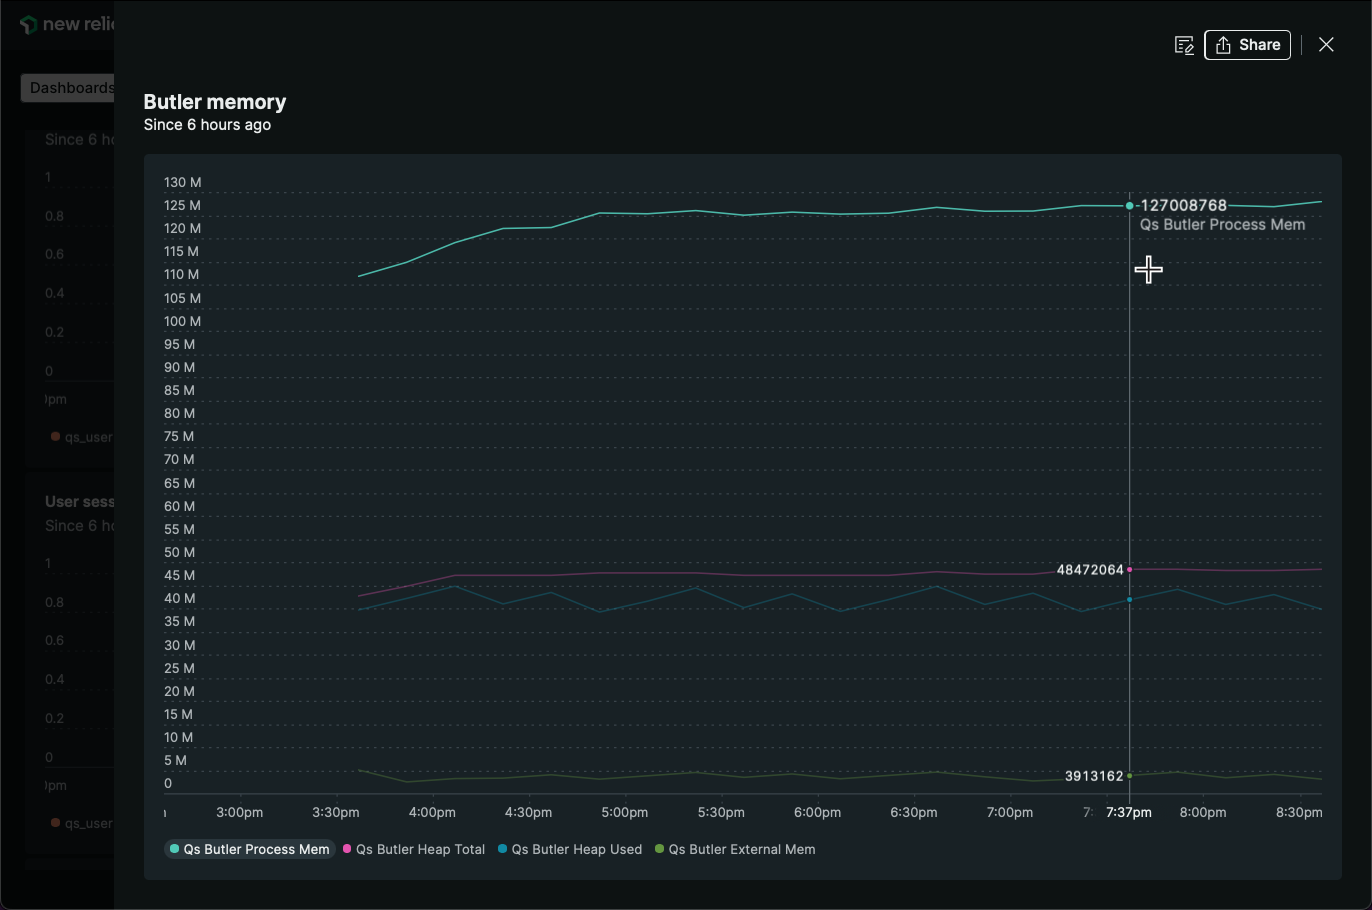
Butler memory usage in New Relic dashboard